

Single-cell transcriptomes reveal characteristic features of human pancreatic islet cell types
- PMID: 26691212
- PMCID: PMC4784001
- DOI: 10.15252/embr.201540946
Single-cell transcriptomes reveal characteristic features of human pancreatic islet cell types
Abstract
Pancreatic islets of Langerhans contain several specialized endocrine cell types, which are commonly identified by the expression of single marker genes. However, the established marker genes cannot capture the complete spectrum of cellular heterogeneity in human pancreatic islets, and existing bulk transcriptome datasets provide averages across several cell populations. To dissect the cellular composition of the human pancreatic islet and to establish transcriptomes for all major cell types, we performed single-cell RNA sequencing on 70 cells sorted from human primary tissue. We used this dataset to validate previously described marker genes at the single-cell level and to identify specifically expressed transcription factors for all islet cell subtypes. All data are available for browsing and download, thus establishing a useful resource of single-cell expression profiles for endocrine cells in human pancreatic islets.
Keywords: alpha cells; beta cells; diabetes; marker genes; single‐cell RNA‐seq.
© 2015 The Authors. Published under the terms of the CC BY NC ND 4.0 license.
Figures

Workflow for obtaining and analyzing single‐cell
RNA ‐seq data from human pancreatic islets.Iterative
PCA /biplot‐based approach for the identification of cell types and cell type‐defining transcripts from single‐cellRNA ‐seq data.Expression (scaled
RPKM values) of cell type‐defining genes as identified in (B) across all single cells. Transcripts and single cells are grouped by cell type as identified in (B).Display of transcriptional similarity between all single cells by
MDS . The coloring scheme is based on the cell types as identified in (B).Relative expression (scaled
RPKM value) of canonical marker genes for the 6 identified pancreatic islet cell populations represented by bubble size and projected onto theMDS profile.

Number of detected transcripts and total aligned reads for each single cell. The red line denotes 500 transcripts, below which samples were excluded from the analysis.
Scatter plots displaying the correlation between the number of input
ERCC RNA molecules and measuredRPKM values in four representative single cells. The Pearson correlation (r) is noted in the upper left corner.Scatter plots correlating raw read counts (left) and
RPKM normalized expression values (right) with transcript length. All adequately covered transcripts (> 25 reads) of all 64 samples were included in this analysis. The observed negative correlation afterRPKM normalization lies in the range of what had been reported previously 19.Raw counts and
RPKM normalized expression values for 10 groups ofERCC spike‐in controls. The amount of molecules spiked into the sequencing reaction is constant within one group, whereas the length of the transcripts varies considerably. Within each group, equal expression values across different transcript lengths thereby confirm thatRPKM normalization does not systematically penalize longer transcripts in the assessedERCC transcript length range of ˜200 to 2,000 bp.ERCC spike‐in controls covered by more than 25 reads are indicated in blue and those with ≤ 25 reads in red.MDS displaying transcriptional similarity between corresponding cell types of a published dataset 20 (prefix: ext) and the current dataset.

Scatter plot displaying single alpha and beta cells, 500‐cell islet samples, as well as bulk islet and beta cell samples from published datasets according to their weighted mean of scaled expression values in alpha and beta cell‐specific profile genes. The three selected profile cells for each cell type are indicated by their sample
ID .Pure and mixed expression profiles consisting of 233 alpha cell‐specific genes and 252 beta cell‐specific genes. Alpha and beta cell‐specific profiles are calculated based on the expression values of the three selected profile cells only, while profile genes were selected based on all single cells classified as alpha or beta cells, which is why the expression gradients in the mix profiles do not always follow the same direction.
Profile correlation curves for each individual sample. The maximum of each curve defines the maximum variance that can be explained (y‐axis) by the corresponding mix profile (x‐axis) providing a measure for the composition of the respective sample.
Diagram explaining the transition from profile correlation curves to sample composition estimates. The profile composition that explains most variance is linearly scaled to the maximum variance explained.
Sample composition estimates for each assessed sample. The differences between the 500‐cell islet samples and bulk samples might be explained by technical effects that enrich for alpha cells during islet cultivation, disassociation, and
FACS purification.

- A
Merged
UCSC Genome Browser tracks for thePDX 1 andARX loci. The respective tracks for all single cells are presented in Appendix Fig S2. - B
Relative expression (scaled
RPKM value) of important transcription factors represented by bubble size and projected onto theMDS profile. - C–F
Cell type‐specific expression of pan‐endocrine (C), alpha cell (D), beta cell (E), and
PP cell (F) transcription factors (red bar: mean expression). The statistical significance of the differential gene expression is presented in Appendix Fig S6.

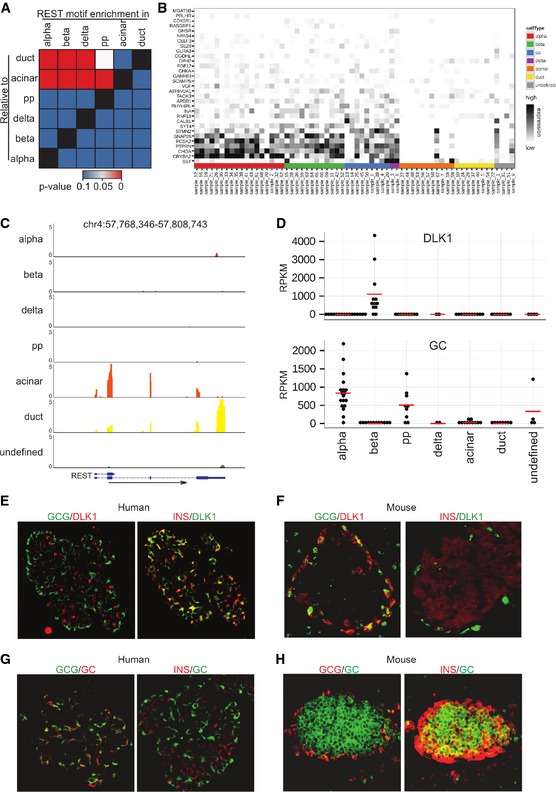
- A
Heatmap displaying the P‐values obtained by pairwise Gene Set Enrichment Analysis (
GSEA ) for theREST ‐binding motif. - B
Relative expression (scaled
RPKM value) of genes contained in theREST ‐binding motif gene set. - C
Merged
UCSC Genome Browser tracks forREST . The respective tracks for all single cells are presented in Appendix Fig S3. - D
Expression of
DLK 1 andGC in human islet cell types (red bar: mean expression). The statistical significance of the differential gene expression is presented in Appendix Fig S6. - E–H
Co‐staining of
DLK1 (E, F) orGC (G, H) with insulin and with glucagon in representative human (E, G) and mouse (F, H) islets.


Cell type specificity for genes reported in diabetes‐related
GWAS . Each gene reported in a diabetes‐relatedGWAS (search for “Diabetes” onGWAS Catalog) was assigned to the pancreatic cell type in which it was found to be most specifically expressed. Ranking was performed as described in Appendix Fig S7B and Dataset EV6.Heatmap showing mean expression values for the most cell type‐specific diabetes‐associated
GWAS genes in the different here identified human islet cell types. Specifically, only genes with a specificity rank lower than 500 (dashed line in panel A) are listed, and genes with equal expression in multiple cell types are not shown. The numbers in the colored boxes indicate the number of studies in which the respective gene has been reported. Heatmaps are colored by mean ln(RPKM ), the mean of the natural logarithm of theRPKM values across all cells of the respective cell type.
References
Publication types
MeSH terms
Substances
LinkOut - more resources
Full Text Sources
Other Literature Sources
Molecular Biology Databases
