. 2015 Dec 21;10(12):e0144824.
doi: 10.1371/journal.pone.0144824. eCollection 2015.

Differential Effects of β-Blockers, Angiotensin II Receptor Blockers, and a Novel AT2R Agonist NP-6A4 on Stress Response of Nutrient-Starved Cardiovascular Cells

Affiliations

Differential Effects of β-Blockers, Angiotensin II Receptor Blockers, and a Novel AT2R Agonist NP-6A4 on Stress Response of Nutrient-Starved Cardiovascular Cells

Abuzar Mahmood et al. PLoS One. .

Abstract

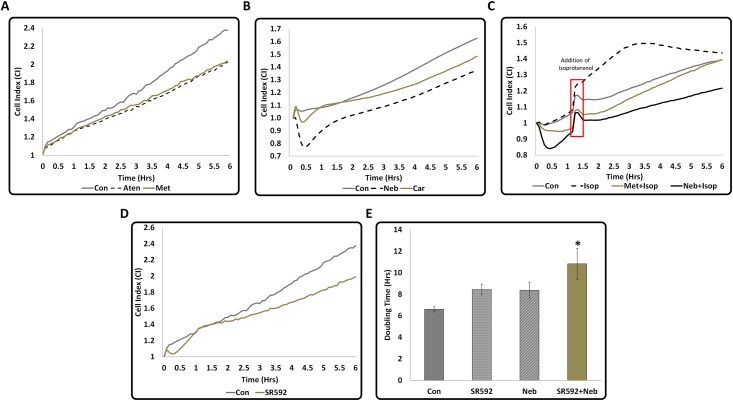
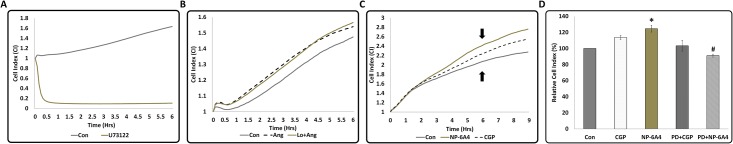
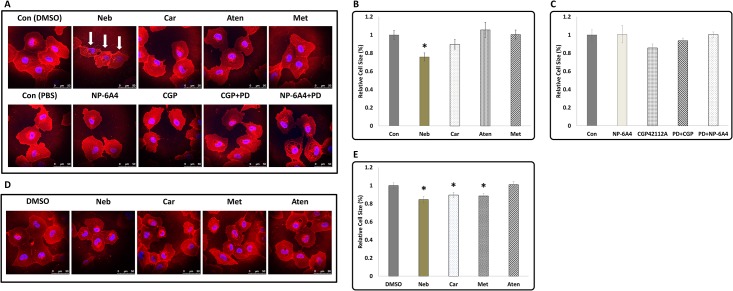
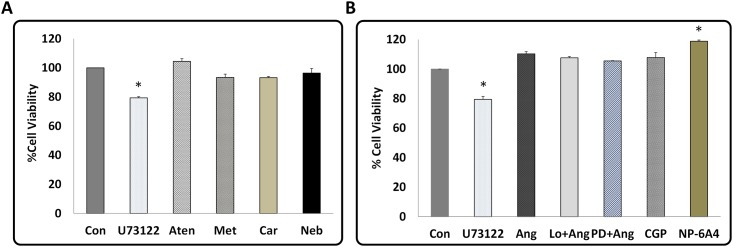
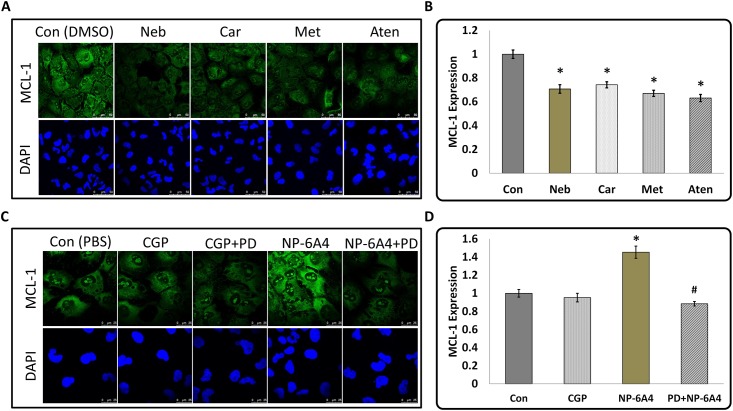
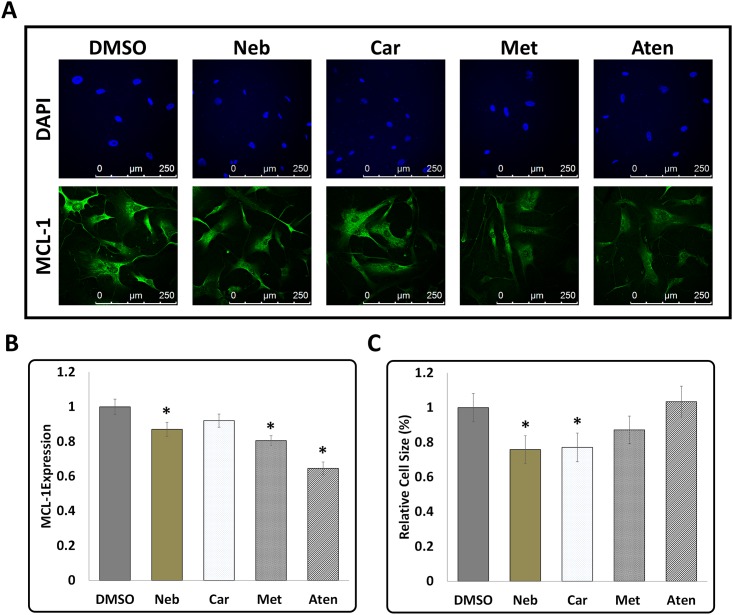
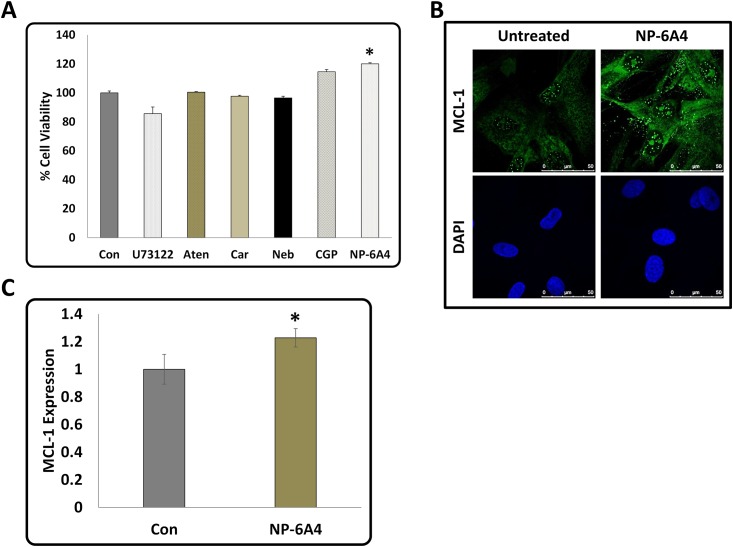
In order to determine differences in cardiovascular cell response during nutrient stress to different cardiovascular protective drugs, we investigated cell responses of serum starved mouse cardiomyocyte HL-1 cells and primary cultures of human coronary artery vascular smooth muscles (hCAVSMCs) to treatment with β-blockers (atenolol, metoprolol, carvedilol, nebivolol, 3 μM each), AT1R blocker losartan (1 μM) and AT2R agonists (CGP42112A and novel agonist NP-6A4, 300 nM each). Treatment with nebivolol, carvedilol, metoprolol and atenolol suppressed Cell Index (CI) of serum-starved HL-1 cells (≤17%, ≤8%, ≤15% and ≤15% respectively) as measured by the Xcelligence Real-Time Cell Analyzer (RTCA). Conversely, CI was increased by Ang II (≥9.6%), CGP42112A (≥14%), and NP-6A4 (≥25%) respectively and this effect was blocked by AT2R antagonist PD123319, but not by AT1R antagonist losartan. Thus, the CI signature for each drug could be unique. MTS cell proliferation assay showed that NP-6A4, but not other drugs, increased viability (≥20%) of HL-1 and hCAVSMCs. Wheat Germ Agglutinin (WGA) staining showed that nebivolol was most effective in reducing cell sizes of HL-1 and hCAVSMCs. Myeloid Cell Leukemia 1 (MCL-1) is a protein critical for cardiovascular cell survival and implicated in cell adhesion. β-blockers significantly suppressed and NP-6A4 increased MCL-1 expression in HL-1 and hCAVSMCs as determined by immunofluorescence. Thus, reduction in cell size and/or MCL-1 expression might underlie β-blocker-induced reduction in CI of HL-1. Conversely, increase in cell viability and MCL-1 expression by NP-6A4 through AT2R could have resulted in NP-6A4 mediated increase in CI of HL-1. These data show for the first time that activation of the AT2R-MCL-1 axis by NP-6A4 in nutrient-stressed mouse and human cardiovascular cells (mouse HL-1 cells and primary cultures of hCAVSMCs) might underlie improved survival of cells treated by NP-6A4 compared to other drugs tested in this study.


Conflict of interest statement

Competing Interests: The authors have declared that no competing interests exist.

Figures

Fig 1
Fig 1. Differences in the CI signatures of 2nd and 3rd generation β-Blockers, Isoproterenol, and the β3-AR inhibitor SR59230A in serum-starved HL-1 cardiomyocytes.
Cell Index (CI) data generated by Xcelligence RTCA when serum starved HL-1 cells were treated with different drugs for six hours are shown in graphs (A-D). All drugs except isoproterenol reduced the rate of increase in CI with time. Since all drugs were dissolved in Dimethyl sulfoxide (DMSO), control cells in this experiment received 0.05% DMSO (similar to the amount of DMSO in the drug preparation). (A) Changes in the CI of 2nd generation β-Blockers Aten (300μM) and Met (300μM) were similar. (B) Changes in the CI of 3rd generation β-Blockers Neb and Car were different from that that of the 2nd generation β-Blockers and also different from each other. A quick suppression (a dip) of CI was observed within 30 minutes of addition of these drugs. This was not observed with the 2nd generation β-Blocker treatments. Suppression of CI was more pronounced with Neb than Car indicating that each drug had unique CI signature. (C) Changes in CI in response to Isoproterenol (Isop) (added after one hour pre-treatment with Neb or Met). The red box indicates the time taken for addition of isoproterenol and the change in the pattern of graph due to the brief temperature change since the door was opened to add the drug. Isoproterenol increased CI initially compared to Con, however, after 2 hours, there was a reduction in CI. (D) Changes in CI in response to β3-AR inhibitor SR59230A exhibiting an initial sudden dip. Values are shown as means, n≥4 and p<0.05 for all treatments compared to control for (A-D). (E) Combination of Neb and SR59230A increases CI doubling time compared to treatment by either drug alone, suggesting further suppression of cell growth. Values are means ± SEM for each point in the graphs, n = 4, *p<0.05 compared to control. All statistical significance determined by one-way ANOVA followed by the LSD post-hoc test.
Fig 2
Fig 2. Effect of phospholipase C inhibition and Angiotensin II Type 2 receptor (AT2R) activation on CI of serum-starved HL-1 cardiomyocytes.
(A) Treatment by PLC inhibitor U73122 resulted in a drastic drop in CI immediately after adding the drug. (B) Treatment by Angiotensin II (Ang II) increased CI compared to Con and pre-treatment with losartan (Lo), an AT1R antagonist did not reduce Ang II-induced increase in CI. Therefore, AT1R activation by Ang II is not responsible for Ang II induced increase in CI. (C) Treatment by AT2R specific agonists increased CI with magnitude of increase of CGP42112A<NP-6A4. CGP42112A is referred as CGP in the graphs. Since difference between CI of the control (treated with saline) and drugs was maximum at about 6 hours, the 6 hour time point was selected for final comparison shown in Fig D. Values are means ± SEM for each point in the graphs, n = 4, *p<0.05 compared to control for graphs A-C. (D) CI at 6-hour time-point showing pre-treatment by AT2R specific inhibitor PD123319 abolishes the effect of CGP42112A and NP-6A4; therefore, the CI increase by these agonists is mediated by AT2R. PD123319 is referred as PD in the graphs. Values are means ± SEM, n≥4 and *p<0.05.
Fig 3
Fig 3. The effect of β-Blockers and AT2R agonists on cell size in HL-1 cardiomyocytes.
(A) Representative images of serum starved HL-1 cells subjected to treatments with beta blockers (top panel) or AT2R agonists (bottom panel) for 6 hours and visualized by WGA staining and nuclear staining with DAPI (scale bars = 50μm). Reduction in cell size after treatment with Neb (marked by white arrows) was visible after 6-hour treatment. (B and C) Quantification of the area of stained cells in Fig A. (D) Representative images of serum starved HL-1 cells subjected to treatments with only beta blockers for 24 hours and visualized by WGA staining and nuclear staining with DAPI (scale bars = 50μm). Met and Car also reduced cell size when treatment was continued for 24 hours. (E) Quantification of the area of stained cells in Fig D. Values are means ± SEM, n≈20 for each treatment, *p<0.05. All statistical significance determined by One-way ANOVA followed by the LSD post-hoc test.
Fig 4
Fig 4. Effect of β-Blockers, Angiotensin II, AT2R agonists, and AT1R- and AT2R-antagonists on cell viability in HL-1 cardiomyocytes.
Changes in cell viability of serum starved HL-1 cardiomyocytes in response to treatment by U73122 and β-Blockers (A), and Ang II, Ang II+ losartan, Ang II+ PD123319, and AT2R agonists (B) as determined by the MTS proliferation assay. (A) As expected, phospholipase C inhibition by U73122 showed a strong suppression of cell viability. Treatment with β-Blockers did not result in any significant difference in cell viability compared to DMSO treated control. (B) Treatment NP-6A4 showed the greatest increase in cell viability. Data for A and B are presented as means ± SEM, n≥3 for all treatments, *p<0.05 compared to control as determined by One-way ANOVA followed by the LSD post-hoc test.
Fig 5
Fig 5. Effects of β-Blockers, and AT2R agonists and antagonists on the expression of anti-apoptotic protein Myeloid Cell Leukemia 1 (MCL-1) in HL-1 cardiomyocytes.
(A and C) Representative images of immunofluorescence staining with anti-MCL-1 antibody and nuclear stain DAPI of HL-1 cardiomyocytes in response to treatment by β-Blockers, and AT2R agonists in the presence and absence of AT2R antagonist PD123319 (scale bars = 50 μm for A and 25μm for C). (B and D) Graphs show quantification of MCL-1 expression in response to treatment with drugs as marked. MCL-1 expression was suppressed in response to treatment by all β-Blockers. Novel agonist NP-6A4 increased MCL-1 expression and this effect was abolished by pretreatment with AT2R specific inhibitor PD123319. Since MCL-1 promotes cell survival under stress [36, 37], these findings implicate the involvement of MCL-1 in CI changes in response to treatment by β-Blockers and AT2R agonists. n≈50 for all treatments, *p<0.05 compared to respective control and #p<0.05 compared to NP-6A4 as determined by Student’s 2-tailed T-test.
Fig 6
Fig 6. Effect of β-Blockers on MCL-1 expression and cell size in Human Coronary Artery Vascular Smooth Muscles Cells.
(A) Representative images of immunofluorescence staining with anti-MCL-1 antibody and nuclear stain DAPI in hCAVSMCs in response to treatment by β-Blockers for a period of 6 hours (scale bars = 250 μm). (B) Quantification of MCL-1 expression in hCAVSMCs showed significant suppression of MCL-1 expression in response to treatment with Neb, Met and Aten (C) Quantification of cell size of hCAVSMCs by WGA staining showed significant suppression by Neb and Car but not Met and Aten. Data is shown as means ± SEM, n≥70 and *p<0.05 compared to control (DMSO) as determined by ANOVA followed by LSD post-test.
Fig 7
Fig 7. Effect of β-Blockers and AT2R agonists on cell viability and effect of novel AT2R agonist NP-6A4 on MCL-1 expression in Human Coronary Artery Vascular Smooth Muscles Cells.
(A) Graph shows data from Cell the cell viability assessment using MTS proliferation assay kit. Treatment with β-Blockers did not significantly alter cell viability of hCAVSMCs while treatment with NP-6A4 resulted in the highest increase in the number of the viable cells. Data presented as means ± SEM, n≥3 and *p<0.05 compared to control (B) Representative images of immunofluorescence staining with anti-MCL-1 antibody and nuclear stain DAPI in hCAVSMCs in response to treatment by NP-6A4 (scale bars = 50 μm). (C) Quantification of MCL-1 expression in hCAVSMCs. Data is shown as means ± SEM, n≈20 and *p<0.05 compared to control as determined by Student’s 2-tailed T-test. Thus, NP-6A4 mediated increase in MCL-1 expression is a common signaling mechanism in mouse HL-1 cardiomyocytes and hCAVSMCs.

Similar articles

Cited by

References

    1. World health Organization (2014). The top 10 causes of death. http://www.who.int/mediacentre/factsheets/fs310/en/
    1. Center for Disease Control and Prevention Fact Sheets (Feb 6th 2015). Leading Causes of Death. http://www.cdc.gov/nchs/fastats/leading-causes-of-death.htm
    1. Ong SB, Samangouei P, Kalkhoran SB, Hausenloy DJ. The mitochondrial permeability transition pore and its role in myocardial ischemia reperfusion injury. J Mol Cell Cardiol. 2015. January;78:23–34 10.1016/j.yjmcc.2014.11.005 - DOI - PubMed
    1. Badalzadeh R, Mokhtari B, Yavari R. Contribution of apoptosis in myocardial reperfusion injury and loss of cardioprotection in diabetes mellitus. J Physiol Sci. 2015. May;65(3):201–15 10.1007/s12576-015-0365-8 - DOI - PMC - PubMed
    1. Gatica D, Chiong M, Lavandero S, Klionsky DJ. Molecular mechanisms of autophagy in the cardiovascular system. irc Res. 2015. January 30;116(3):456–67 - PMC - PubMed

Publication types

MeSH terms

Substances

LinkOut - more resources