. 2015 Dec 21;10(12):e0144854.
doi: 10.1371/journal.pone.0144854. eCollection 2015.

Antibiotic Treatment Affects Intestinal Permeability and Gut Microbial Composition in Wistar Rats Dependent on Antibiotic Class

Affiliations

Antibiotic Treatment Affects Intestinal Permeability and Gut Microbial Composition in Wistar Rats Dependent on Antibiotic Class

Monica Vera-Lise Tulstrup et al. PLoS One. .

Abstract

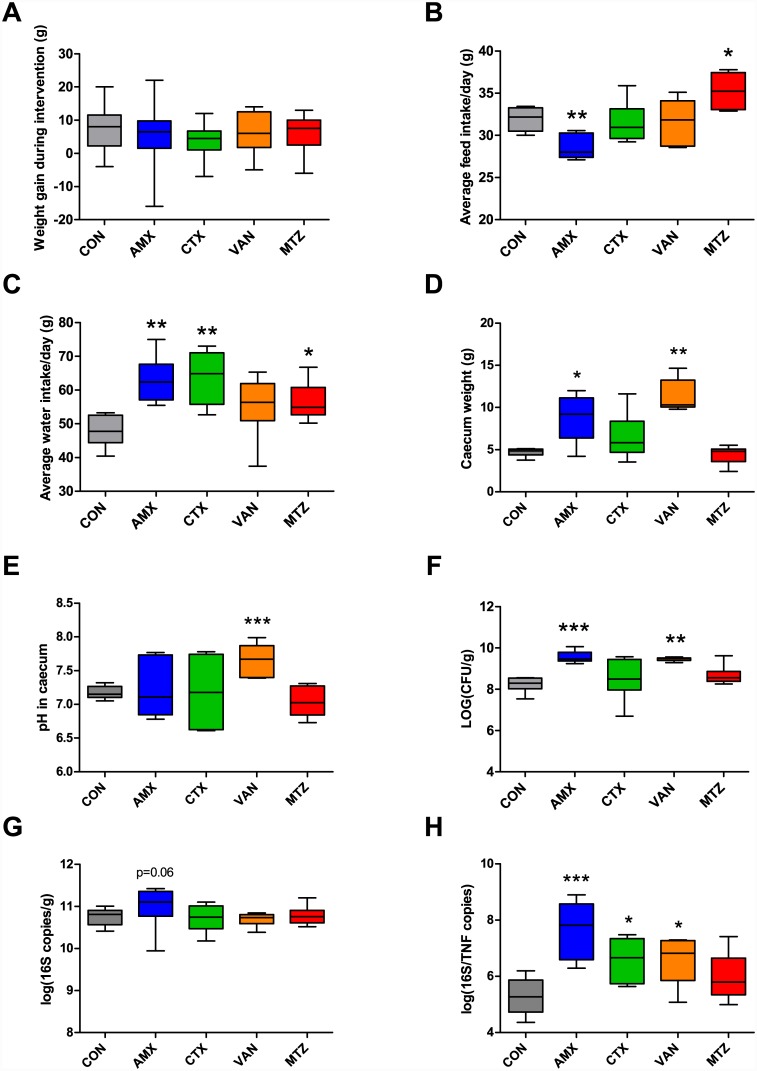
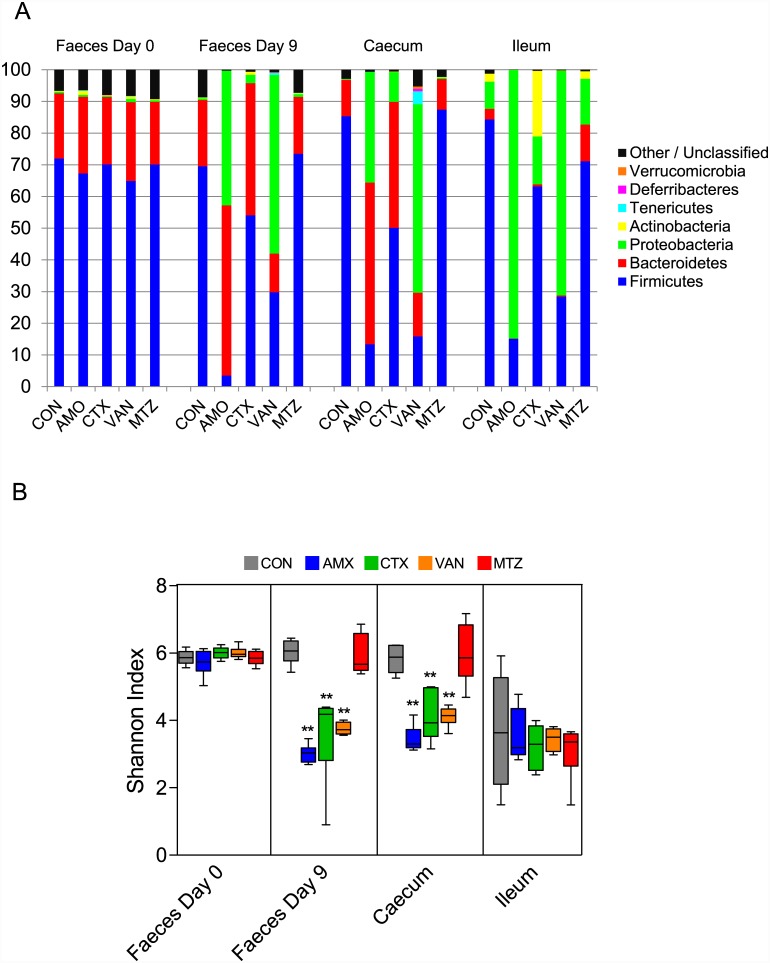
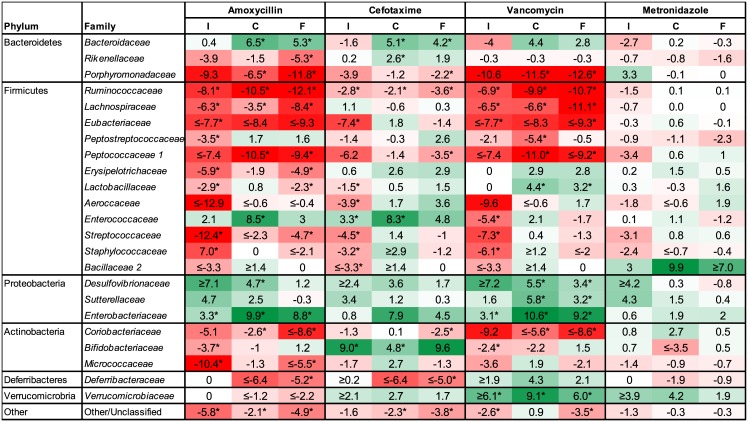
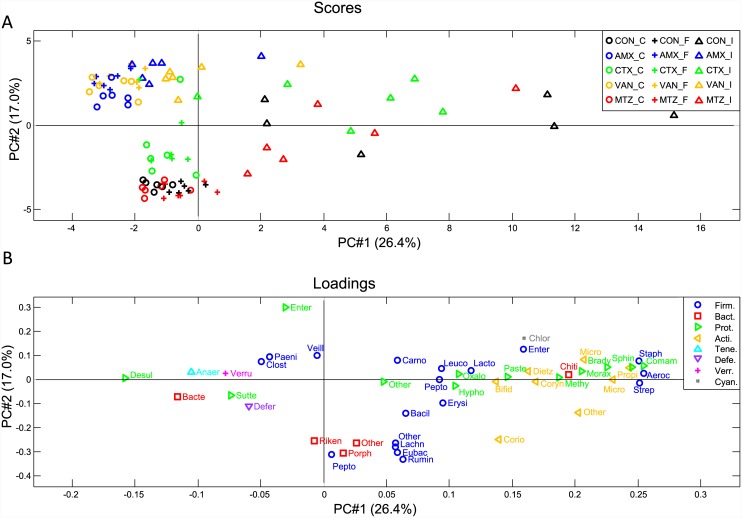
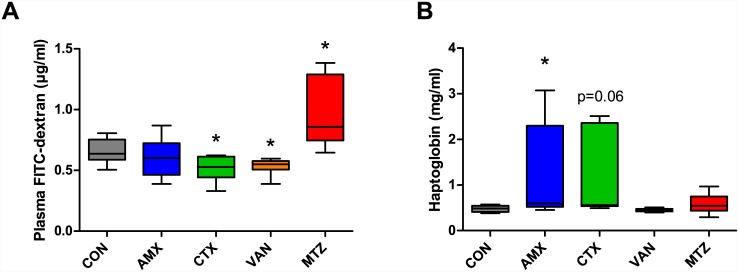
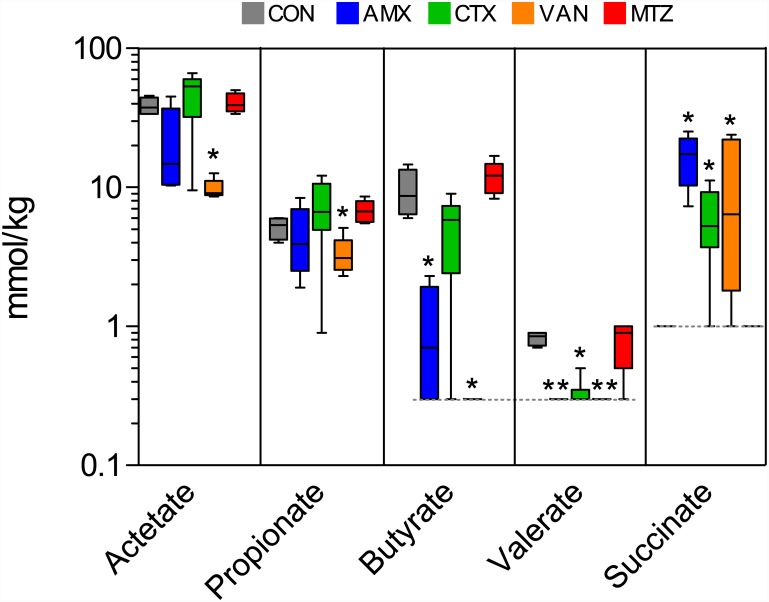
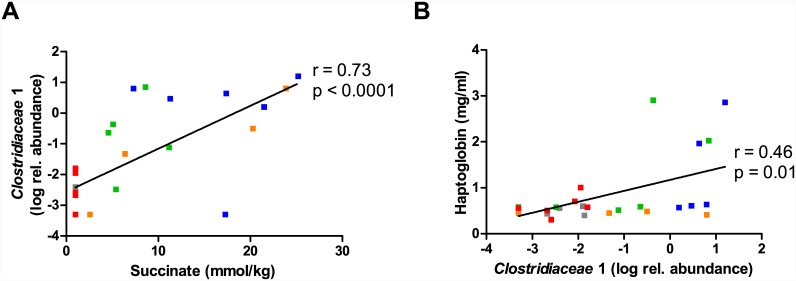
Antibiotics are frequently administered orally to treat bacterial infections not necessarily related to the gastrointestinal system. This has adverse effects on the commensal gut microbial community, as it disrupts the intricate balance between specific bacterial groups within this ecosystem, potentially leading to dysbiosis. We hypothesized that modulation of community composition and function induced by antibiotics affects intestinal integrity depending on the antibiotic administered. To address this a total of 60 Wistar rats (housed in pairs with 6 cages per group) were dosed by oral gavage with either amoxicillin (AMX), cefotaxime (CTX), vancomycin (VAN), metronidazole (MTZ), or water (CON) daily for 10-11 days. Bacterial composition, alpha diversity and caecum short chain fatty acid levels were significantly affected by AMX, CTX and VAN, and varied among antibiotic treatments. A general decrease in diversity and an increase in the relative abundance of Proteobacteria was observed for all three antibiotics. Additionally, the relative abundance of Bifidobacteriaceae was increased in the CTX group and both Lactobacillaceae and Verrucomicrobiaceae were increased in the VAN group compared to the CON group. No changes in microbiota composition or function were observed following MTZ treatment. Intestinal permeability to 4 kDa FITC-dextran decreased after CTX and VAN treatment and increased following MTZ treatment. Plasma haptoglobin levels were increased by both AMX and CTX but no changes in expression of host tight junction genes were found in any treatment group. A strong correlation between the level of caecal succinate, the relative abundance of Clostridiaceae 1 family in the caecum, and the level of acute phase protein haptoglobin in blood plasma was observed. In conclusion, antibiotic-induced changes in microbiota may be linked to alterations in intestinal permeability, although the specific interactions remain to be elucidated as changes in permeability did not always result from major changes in microbiota and vice versa.


Conflict of interest statement

Competing Interests: The authors have declared that no competing interests exist.

Figures

Fig 1
Fig 1. Effects of antibiotics on anthropometric measures and bacterial load.
(A) Weight gain during the intervention with antibiotics (Day 0 to 9). (B) Average feed intake per day during the intervention period. (C) Average water intake per day during the intervention period. (D) Weight of caecum and (E) pH in caecum content. (F) Total anaerobic bacterial load in faecal samples determined by culturing on Wilkins-Chalgren agar. (G) Total number of 16S rRNA gene copies/g faecal sample determined by qPCR and (H) 16S rRNA gene to TNF gene ratio in faecal samples determined by qPCR. In all panels boxplots with whisker denoting the full range are shown. Significant differences between treatment groups and the control group are indicated by asterisks (*P < 0.05, **P < 0.01, ***P < 0.001). CON, control; AMX, amoxicillin; CTX, cefotaxime; VAN, vancomycin; MTZ, Metronidazole.
Fig 2
Fig 2. Bacterial community composition and Shannon diversity in faeces, caecum and ileum content based on 16S rRNA gene sequencing.
(A) The average bacterial composition for each treatment group is shown at the phylum level for faecal samples (Day 0 and Day 9), caecal and ileal content. (B) Shannon diversity index determined in faecal samples (Day 0 and 9), caecal and ileal content for animal in CON, control (grey); AMX, amoxicillin (blue); CTX, cefotaxime (green); VAN, vancomycin (yellow) and MTZ, Metronidazole (red) groups. Boxplots with whisker denoting the full range are shown. Significant differences from CON group are indicated by asterisks (*P < 0.05, **P < 0.01).
Fig 3
Fig 3. Fold change of bacterial families for treatment groups compared to the control group in ileum, caecum and faeces.
Values show fold-changes (log2) in relative abundance (rel. abun.) of bacterial families in ileum (I), caecum (C) and faeces (F) of antibiotic treated groups (ABX) compared to the same bacterial groups in the control (CON) group (log2(rel. abun. ABX / rel. abun. CON)). Only bacterial families which change significantly are shown. Intensity of green and red shading indicate levels of increase or decrease respectively and asterisks indicate significant differences after correcting for multiple testing (q<0.05). When no reads were observed for a specific family, a value of 0.0005% was applied as a lower detection limit for calculations (fold-changes indicated with ≤ or ≥).
Fig 4
Fig 4. Principal component analysis (PCA) of the relative abundances of detected bacterial families in caecal, faecal and ileal samples.
(A) Score plot showing samples grouped according to treatment groups CON (black), AMX (blue), CTX (green), VAN (yellow) and MTZ (red), with six animals in each group. ○ Caecal samples; + Faeces samples and Δ Ilium samples. (B) Loading plot indicating each of the bacterial families colored according to phylum. Firm, Firmicutes (blue); Bact, Bacteroidetes (red); Prot, Proteobacteria (green), Acti, Actinobacteria (yellow); Tene, Tenericutes (light blue); Defe, Deferribacteres (purple); Verr, Verrucomicrobia (lilac) and Cyan, Cyanobacteria (grey).
Fig 5
Fig 5. Blood plasma measurements.
(A) Plasma FITC-dextran concentrations and (B) Haptoglobin concentration in blood plasma. Boxplots with whisker denoting the full ranges are shown. CON, control (grey); AMX, amoxicillin (blue); CTX, cefotaxime (green); VAN, vancomycin (yellow); MTZ, Metronidazole (red). Significant differences from CON group are indicated by asterisks (*P < 0.05).
Fig 6
Fig 6. Short chain fatty acid and succinate.
Concentrations of acetate, propionate, butyrate, valerate and succinate in caecum for each treatment group. Boxplots with whisker denoting the full range are shown. Control (grey), amoxicillin (blue), cefotaxime (green), vancomycin (yellow) and metronidazole (red). The dashed lines indicate limit of detection. Significant differences from CON group are indicated by asterisks (*P < 0.05, **P < 0.01).
Fig 7
Fig 7. Correlation analysis.
(A) Spearman correlation between succinate and the relative abundance of Clostridiaceae 1 family and (B) between the relative abundance of Clostridiaceae 1 family and plasma haptoglobin levels. Each dot represents individual animals within the CON, control (grey); AMX, amoxicillin (blue); CTX, cefotaxime (green); VAN, vancomycin (yellow); MTZ, Metronidazole (red) groups and lines show the linear regression. Spearman r and P values are shown.

References

    1. Maynard CL, Elson CO, Hatton RD, Weaver CT. Reciprocal interactions of the intestinal microbiota and immune system. Nature. 2012;489: 231–41. 10.1038/nature11551 - DOI - PMC - PubMed
    1. Cani PD, Possemiers S, Van de Wiele T, Guiot Y, Everard A, Rottier O, et al. Changes in gut microbiota control inflammation in obese mice through a mechanism involving GLP-2-driven improvement of gut permeability. Gut. 2009;58: 1091–103. 10.1136/gut.2008.165886 - DOI - PMC - PubMed
    1. Lewis K. Platforms for antibiotic discovery. Nat Rev Drug Discov. 2013;12: 371–87. 10.1038/nrd3975 - DOI - PubMed
    1. Jernberg C, Löfmark S, Edlund C, Jansson JK. Long-term impacts of antibiotic exposure on the human intestinal microbiota. Microbiology. 2010;156: 3216–23. 10.1099/mic.0.040618-0 - DOI - PubMed
    1. Ubeda C, Pamer EG. Antibiotics, microbiota, and immune defense. Trends Immunol. 2012;33: 459–66. 10.1016/j.it.2012.05.003 - DOI - PMC - PubMed

Publication types

Associated data