Contractile dynamics change before morphological cues during fluorescence [corrected] illumination
- PMID: 26691776
- PMCID: PMC4686977
- DOI: 10.1038/srep18513
Contractile dynamics change before morphological cues during fluorescence [corrected] illumination
Erratum in
-
Corrigendum: Contractile dynamics change before morphological cues during fluorescence illumination.Sci Rep. 2016 Feb 18;6:21218. doi: 10.1038/srep21218. Sci Rep. 2016. PMID: 26887932 Free PMC article. No abstract available.
Abstract
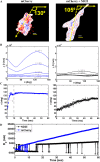
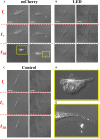
Illumination can have adverse effects on live cells. However, many experiments, e.g. traction force microscopy, rely on fluorescence microscopy. Current methods to assess undesired photo-induced cell changes rely on qualitative observation of changes in cell morphology. Here we utilize a quantitative technique to identify the effect of light on cell contractility prior to morphological changes. Fibroblasts were cultured on soft elastic hydrogels embedded with fluorescent beads. The adherent cells generated contractile forces that deform the substrate. Beads were used as fiducial markers to quantify the substrate deformation over time, which serves as a measure of cell force dynamics. We find that cells exposed to moderate fluorescence illumination (λ = 540-585 nm, I = 12.5 W/m(2), duration = 60 s) exhibit rapid force relaxation. Strikingly, cells exhibit force relaxation after only 2 s of exposure, suggesting that photo-induced relaxation occurs nearly immediately. Evidence of photo-induced morphological changes were not observed for 15-30 min after illumination. Force relaxation and morphological changes were found to depend on wavelength and intensity of excitation light. This study demonstrates that changes in cell contractility reveal evidence of a photo-induced cell response long before any morphological cues.
Figures


Similar articles
-
Dose-independent threshold illumination for non-invasive time-lapse fluorescence imaging of live cells.Extreme Mech Lett. 2021 Jul;46:101249. doi: 10.1016/j.eml.2021.101249. Epub 2021 Mar 3. Extreme Mech Lett. 2021. PMID: 34095408 Free PMC article.
-
Mechanics of cell spreading within 3D-micropatterned environments.Lab Chip. 2011 Mar 7;11(5):805-12. doi: 10.1039/c0lc00221f. Epub 2010 Dec 6. Lab Chip. 2011. PMID: 21132213
-
Photobiomodulation therapy can change actin filaments of 3T3 mouse fibroblast.Lasers Med Sci. 2020 Apr;35(3):585-597. doi: 10.1007/s10103-019-02852-y. Epub 2019 Aug 13. Lasers Med Sci. 2020. PMID: 31410615
-
Anisotropic mechanics and dynamics of a living mammalian cytoplasm.Soft Matter. 2019 Jan 2;15(2):190-199. doi: 10.1039/c8sm01708e. Soft Matter. 2019. PMID: 30488938
-
AFM review study on pox viruses and living cells.Biophys J. 1997 Oct;73(4):2183-94. doi: 10.1016/S0006-3495(97)78250-X. Biophys J. 1997. PMID: 9336215 Free PMC article. Review.
Cited by
-
Assessing Phototoxicity in a Mammalian Cell Line: How Low Levels of Blue Light Affect Motility in PC3 Cells.Front Cell Dev Biol. 2021 Dec 17;9:738786. doi: 10.3389/fcell.2021.738786. eCollection 2021. Front Cell Dev Biol. 2021. PMID: 34977004 Free PMC article.
-
Dose-independent threshold illumination for non-invasive time-lapse fluorescence imaging of live cells.Extreme Mech Lett. 2021 Jul;46:101249. doi: 10.1016/j.eml.2021.101249. Epub 2021 Mar 3. Extreme Mech Lett. 2021. PMID: 34095408 Free PMC article.
-
Small-scale displacement fluctuations of vesicles in fibroblasts.Sci Rep. 2018 Sep 5;8(1):13294. doi: 10.1038/s41598-018-31656-3. Sci Rep. 2018. PMID: 30185883 Free PMC article.
-
Ultrasound-activated ciliary bands for microrobotic systems inspired by starfish.Nat Commun. 2021 Nov 9;12(1):6455. doi: 10.1038/s41467-021-26607-y. Nat Commun. 2021. PMID: 34753910 Free PMC article.
References
-
- Marx V. Is super-resolution microscopy right for you? Nat. Meth. 10, 1157–1163 (2013). - PubMed
-
- Xiao J. Single-Molecule Imaging in Live Cells. In Handbook of Single-Molecule Biophysics. (eds Hinterdorfer P. & Oijen A.) 43–93, (Springer, 2009).
-
- Barroso Peña Á. et al. Optical tweezers induced photodamage in living cells quantified with digital holographic phase microscopy. Paper presented at Proc. SPIE 8427.: Biophotonics: Photonic Solutions for Better Health Care III, Brussels, Belgium, doi: 10.1117/12.940785. (2012, 1). - DOI
Publication types
MeSH terms
LinkOut - more resources
Full Text Sources
Other Literature Sources

