Thalamus provides layer 4 of primary visual cortex with orientation- and direction-tuned inputs
- PMID: 26691829
- PMCID: PMC4731241
- DOI: 10.1038/nn.4196
Thalamus provides layer 4 of primary visual cortex with orientation- and direction-tuned inputs
Abstract
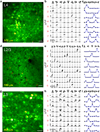
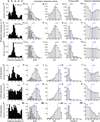
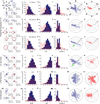
Understanding the functions of a brain region requires knowing the neural representations of its myriad inputs, local neurons and outputs. Primary visual cortex (V1) has long been thought to compute visual orientation from untuned thalamic inputs, but very few thalamic inputs have been measured in any mammal. We determined the response properties of ∼ 28,000 thalamic boutons and ∼ 4,000 cortical neurons in layers 1-5 of awake mouse V1. Using adaptive optics that allows accurate measurement of bouton activity deep in cortex, we found that around half of the boutons in the main thalamorecipient L4 carried orientation-tuned information and that their orientation and direction biases were also dominant in the L4 neuron population, suggesting that these neurons may inherit their selectivity from tuned thalamic inputs. Cortical neurons in all layers exhibited sharper tuning than thalamic boutons and a greater diversity of preferred orientations. Our results provide data-rich constraints for refining mechanistic models of cortical computation.
Figures


Similar articles
-
Tuned thalamic excitation is amplified by visual cortical circuits.Nat Neurosci. 2013 Sep;16(9):1315-23. doi: 10.1038/nn.3488. Epub 2013 Aug 11. Nat Neurosci. 2013. PMID: 23933748 Free PMC article.
-
Population receptive fields of ON and OFF thalamic inputs to an orientation column in visual cortex.Nat Neurosci. 2011 Feb;14(2):232-8. doi: 10.1038/nn.2729. Epub 2011 Jan 9. Nat Neurosci. 2011. PMID: 21217765
-
Vision: more than expected in the early visual system.Curr Biol. 2013 Aug 19;23(16):R681-4. doi: 10.1016/j.cub.2013.07.049. Curr Biol. 2013. PMID: 23968921
-
The dynamics of visual responses in the primary visual cortex.Prog Brain Res. 2007;165:21-32. doi: 10.1016/S0079-6123(06)65003-6. Prog Brain Res. 2007. PMID: 17925238 Review.
-
Dynamics of orientation selectivity in the primary visual cortex and the importance of cortical inhibition.Neuron. 2003 Jun 5;38(5):689-99. doi: 10.1016/s0896-6273(03)00332-5. Neuron. 2003. PMID: 12797955 Review.
Cited by
-
Two-photon calcium imaging of neuronal activity.Nat Rev Methods Primers. 2022;2(1):67. doi: 10.1038/s43586-022-00147-1. Epub 2022 Sep 1. Nat Rev Methods Primers. 2022. PMID: 38124998 Free PMC article.
-
Propagation of orientation selectivity in a spiking network model of layered primary visual cortex.PLoS Comput Biol. 2019 Jul 19;15(7):e1007080. doi: 10.1371/journal.pcbi.1007080. eCollection 2019 Jul. PLoS Comput Biol. 2019. PMID: 31323031 Free PMC article.
-
Adaptive optics for high-resolution imaging.Nat Rev Methods Primers. 2021;1:68. doi: 10.1038/s43586-021-00066-7. Epub 2021 Oct 14. Nat Rev Methods Primers. 2021. PMID: 35252878 Free PMC article.
-
How Sleep Shapes Thalamocortical Circuit Function in the Visual System.Annu Rev Vis Sci. 2019 Sep 15;5:295-315. doi: 10.1146/annurev-vision-091718-014715. Epub 2019 Jul 5. Annu Rev Vis Sci. 2019. PMID: 31283451 Free PMC article. Review.
-
An Unexpected Dependence of Cortical Depth in Shaping Neural Responsiveness and Selectivity in Mouse Visual Cortex.eNeuro. 2020 Mar 23;7(2):ENEURO.0497-19.2020. doi: 10.1523/ENEURO.0497-19.2020. Print 2020 Mar/Apr. eNeuro. 2020. PMID: 32051142 Free PMC article.
References
Publication types
MeSH terms
Grants and funding
LinkOut - more resources
Full Text Sources
Other Literature Sources
Molecular Biology Databases

