. 2016 Mar 1:135:191-200.
doi: 10.1016/j.jprot.2015.12.006. Epub 2015 Dec 9.

Intrinsic disorder and multiple phosphorylations constrain the evolution of the flightin N-terminal region

Affiliations

Intrinsic disorder and multiple phosphorylations constrain the evolution of the flightin N-terminal region

Dominick Lemas et al. J Proteomics. .

Abstract

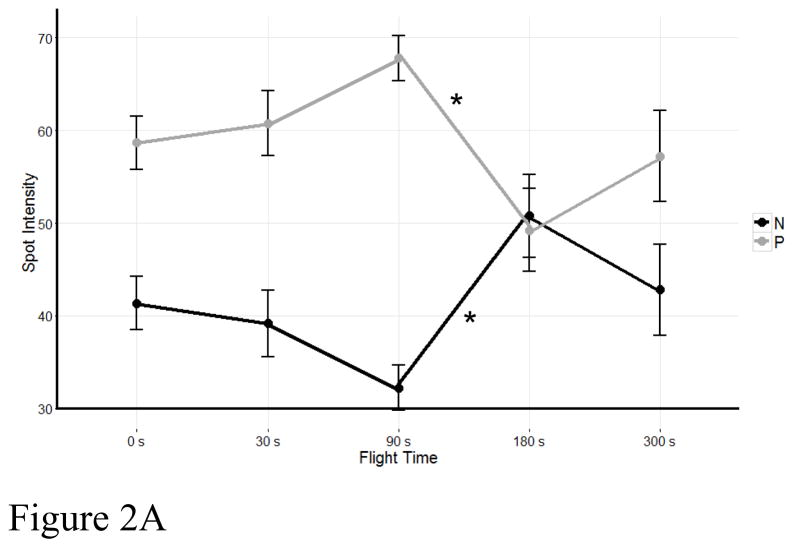
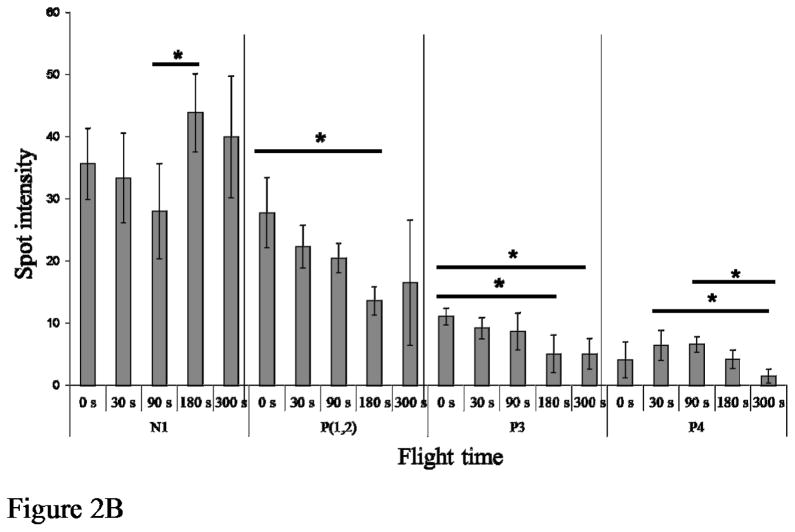
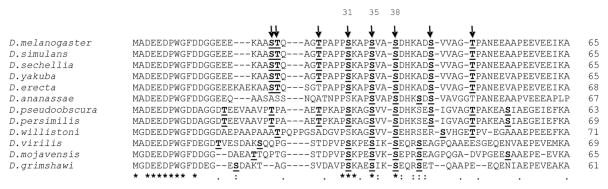
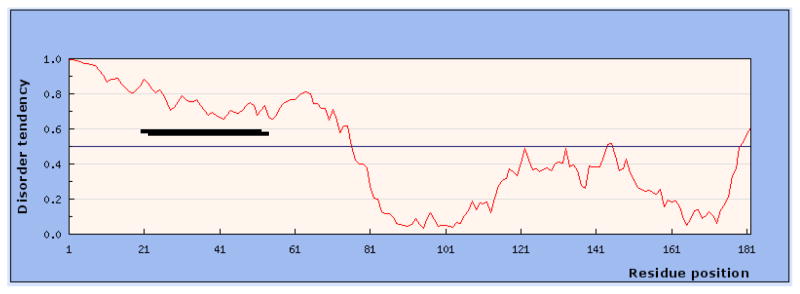
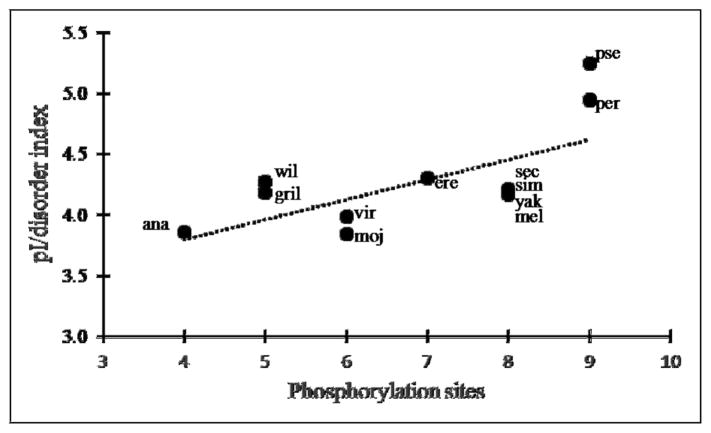
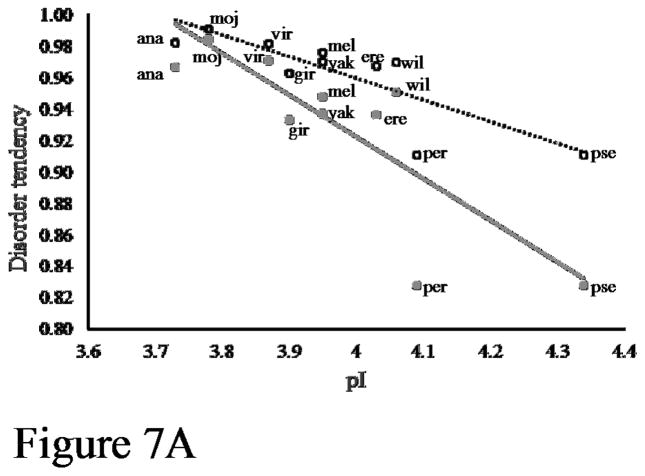
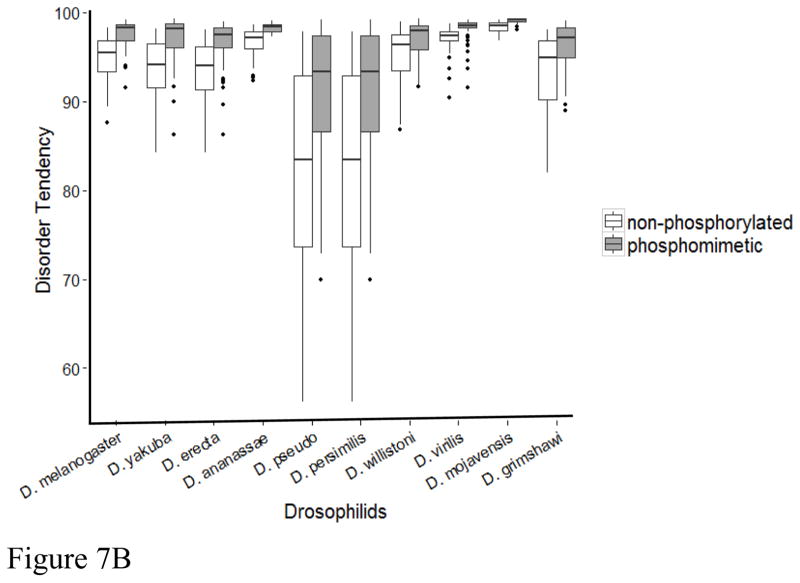
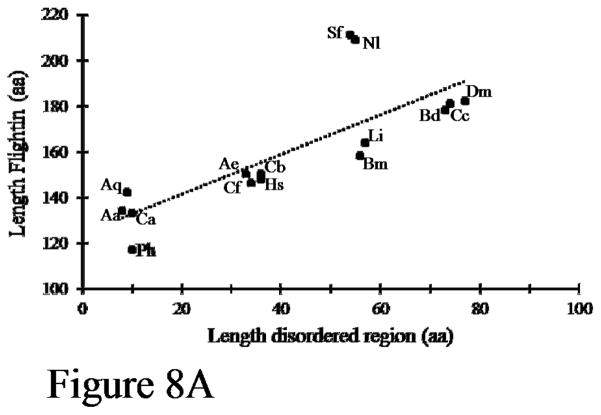
Flightin is a myosin binding phosphoprotein that originated in the ancestor to Pancrustacea ~500 MYA. In Drosophila melanogaster, flightin is essential for length determination and flexural rigidity of thick filaments. Here, we show that among 12 Drosophila species, the N-terminal region is characterized by low sequence conservation, low pI, a cluster of phosphorylation sites, and a high propensity to intrinsic disorder (ID) that is augmented by phosphorylation. Using mass spectrometry, we identified eight phosphorylation sites within a 29 amino acid segment in the N-terminal region of D. melanogaster flightin. We show that phosphorylation of D. melanogaster flightin is modulated during flight and, through a comparative analysis to orthologs from other Drosophila species, we found phosphorylation sites that remain invariant, sites that retain the charge character, and sites that are clade-specific. While the number of predicted phosphorylation sites differs across species, we uncovered a conserved pattern that relates the number of phosphorylation sites to pI and ID. Extending the analysis to orthologs of other insects, we found additional conserved features in flightin despite the near absence of sequence identity. Collectively, our results demonstrate that structural constraints demarcate the evolution of the highly variable N-terminal region.


Figures

Figure 1
Figure 1
Western blots of 2-DE. Each panel is a representative western blot showing flightin protein species present during the indicated flight time, in seconds (top right corner). Spot assignation based on Vigoreaux & Perry [10]. For all blots, pH gradient is 7 to 4, left to right.
Figure 2
Figure 2
Quantitation of D. melanogaster flightin protein species expression during flight. (A) Sum of N and P protein species for each flight time where the X-axis represents time in seconds and the Y-axis represents the mean spot intensity value (in pixels) ± SE. Asterisks indicate a significant drop in P protein species intensity between 90 and 180 seconds of flight and a corresponding increase in intensity of N protein species. (B) Quantitation of individual flightin protein species across flight times. Only protein species whose intensity changed significantly during flight are shown. P1 and P2 are treated as one species as they do not always resolve into distinct spots. Asterisks indicate significant differences in spot intensity between time points within each bin as follows: N1, between 90 seconds and 180 seconds (p=0.046, α=0.05); P1/P2, between 0 seconds and 180 seconds (p=0.008, α=0.05); P3, between 0 seconds and 180 seconds (p=0.010, α=0.05), and between 0 seconds and 300 seconds (p=0.010, α=0.05); P4, between 30 seconds and 300 seconds (p=0.031, α=0.05), and between 90 seconds and 300 seconds (p=0.016, α=0.05).
Figure 2
Figure 2
Quantitation of D. melanogaster flightin protein species expression during flight. (A) Sum of N and P protein species for each flight time where the X-axis represents time in seconds and the Y-axis represents the mean spot intensity value (in pixels) ± SE. Asterisks indicate a significant drop in P protein species intensity between 90 and 180 seconds of flight and a corresponding increase in intensity of N protein species. (B) Quantitation of individual flightin protein species across flight times. Only protein species whose intensity changed significantly during flight are shown. P1 and P2 are treated as one species as they do not always resolve into distinct spots. Asterisks indicate significant differences in spot intensity between time points within each bin as follows: N1, between 90 seconds and 180 seconds (p=0.046, α=0.05); P1/P2, between 0 seconds and 180 seconds (p=0.008, α=0.05); P3, between 0 seconds and 180 seconds (p=0.010, α=0.05), and between 0 seconds and 300 seconds (p=0.010, α=0.05); P4, between 30 seconds and 300 seconds (p=0.031, α=0.05), and between 90 seconds and 300 seconds (p=0.016, α=0.05).
Figure 3
Figure 3
Summary of phosphorylation site identification in flightin protein species. The top diagram depicts the organization of flightin. The N-terminal region is denoted in gray, followed by a spacer region (green bar), the conserved WYR domain [19], and a C-terminal domain (black rectangle, [18]). Below it is the amino acid sequence from Lys 18 to Ala 51 (D. melanogaster numbering). Numbers in the table indicate how many peptides including each phosphorylated site were identified in the protein species listed on the left column.
Figure 4
Figure 4
Amino acid sequence alignment for the N-terminal region of flightin from 12 Drosophila species. Arrows indicate phosphorylation sites in D. melanogaster identified in this study. Numbers above arrows indicate positions of the three conserved serines (D. melanogaster numbering). Amino acids in bold and underlined are predicted to be phosphorylated (NetPhos 2.0). Note the correspondence between predictions and mapped sites in D. melanogaster is 100%. Symbols in the bottom row indicate strict identity (*) or conserved changes (:, .).
Figure 5
Figure 5
Analysis of D. melanogaster flightin with IUPred prediction method. Residues with scores greater than 0.5 (horizontal line) are predicted to be disordered. By this criteria, the entire N-terminal region has a high probability of intrinsic disorder. A similar result was obtained for orthologs from eleven other Drosophila species. Bold horizontal line indicates region of clustered phosphorylations.
Figure 6
Figure 6
Relation between number of predicted phosphorylation sites and the ratio of pI to disorder index, calculated by IUPRED. Each dot represents a Drosophila species, as follows: ana (D. ananassae), wil (D. willistoni), gri (D. grimshawi), vir (D. virilis), moj (D. mojavensis), ere (D. erecta), sec (D. sechellia), sim (D. simulans), mel (D. melanogaster), yak (D. yakuba), pse (D. pseudoobscura), per (D. persimilis). The dotted line represents the linear best fit (R2=0.44).
Figure 7
Figure 7
Phosphorylation increases disorder tendency. (A) Each pair of vertically aligned symbols represent the non-phosphorylated (filled symbol) and phosphomimetic (open symbol) N-terminal region from the indicated species (see Figure 6 legend for abbreviations. D. simulans and D. sechellia are superimposed on D. melanogaster). Broken lines represent best fit for non-phosphorylated (blue, R2 = 0.677) and phosphorylated (red, = 0.680) orthologs. (B) Box plots showing significant difference in disorder index between non-posphorylated and phosphomimetic pairs for all Drosophila species. Disorder index calculated by IUPRED.
Figure 7
Figure 7
Phosphorylation increases disorder tendency. (A) Each pair of vertically aligned symbols represent the non-phosphorylated (filled symbol) and phosphomimetic (open symbol) N-terminal region from the indicated species (see Figure 6 legend for abbreviations. D. simulans and D. sechellia are superimposed on D. melanogaster). Broken lines represent best fit for non-phosphorylated (blue, R2 = 0.677) and phosphorylated (red, = 0.680) orthologs. (B) Box plots showing significant difference in disorder index between non-posphorylated and phosphomimetic pairs for all Drosophila species. Disorder index calculated by IUPRED.
Figure 8
Figure 8
Properties of the flightin N-terminal region. (A) The length (number of amino acids) of the N-terminal disordered region is proportional to the length of the protein. Each dot represents one species ortholog, as follows: Dm, Drosophila melanogaster; Cc, Ceratitis capitate; Bd, Bactrocera dorsalis; Li, Lethocerus indicus; Bm, Bombyx mandarina & mori; Nl, Nilaparvata lugens; Sf, Sogatella furcifera; Cb, Cerapachys biroi; Hs, Harpegnathos saltator; Cf, Camponotus floridanus; Ae, Acromyrmex echinatior; Ph, Pediculus humanus; Ca, Corethrella appendiculata; Aq, Anopheles aquasalis; Aa, Aedes albopictus. Dotted line represents linear best fit (R2 = 0.613). Note that the length of the disordered region clusters in multiples of 9. (B) Length of the linker region increases as the length of the disordered region decreases.
Figure 8
Figure 8
Properties of the flightin N-terminal region. (A) The length (number of amino acids) of the N-terminal disordered region is proportional to the length of the protein. Each dot represents one species ortholog, as follows: Dm, Drosophila melanogaster; Cc, Ceratitis capitate; Bd, Bactrocera dorsalis; Li, Lethocerus indicus; Bm, Bombyx mandarina & mori; Nl, Nilaparvata lugens; Sf, Sogatella furcifera; Cb, Cerapachys biroi; Hs, Harpegnathos saltator; Cf, Camponotus floridanus; Ae, Acromyrmex echinatior; Ph, Pediculus humanus; Ca, Corethrella appendiculata; Aq, Anopheles aquasalis; Aa, Aedes albopictus. Dotted line represents linear best fit (R2 = 0.613). Note that the length of the disordered region clusters in multiples of 9. (B) Length of the linker region increases as the length of the disordered region decreases.

Similar articles

Cited by

References

    1. Grimaldi D, Engel MS. Evolution of the insects. Cambridge: Cambridge University Press; 2005.
    1. Wilson EO. The diversity of life. New York: W. W. Norton & Company; 1992.
    1. Brodsky AK. The evolution of insect flight. Oxford: Oxford University Press; 1994.
    1. Cullen MJ. The distribution of asynchronous muscle in insects with special reference to the Hemiptera: an electron microscope study. J Ent. 1974;49A:17–41.
    1. Smith DS. The structure of insect muscles. In: King RC, Akai H, editors. Insect ultrastructure. New York: Academic Press; 1984. pp. 111–50.

Publication types

LinkOut - more resources