. 2016 Apr 1;594(7):1841-54.
doi: 10.1113/JP271650. Epub 2016 Jan 23.

Signalling beyond photon absorption: extracellular retinoids and growth factors modulate rod photoreceptor sensitivity

Affiliations

Signalling beyond photon absorption: extracellular retinoids and growth factors modulate rod photoreceptor sensitivity

Alex S McKeown et al. J Physiol. .

Abstract

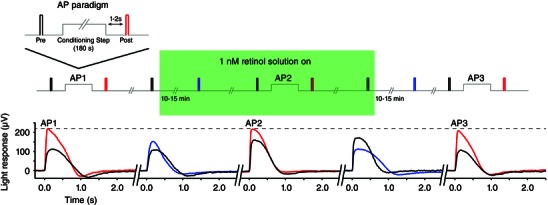
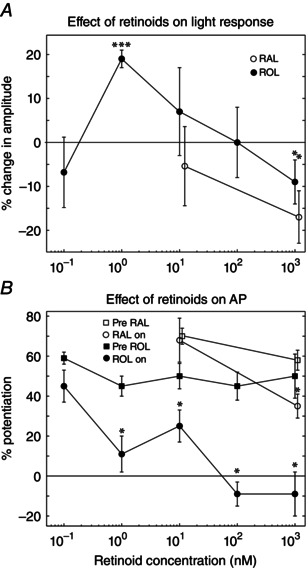
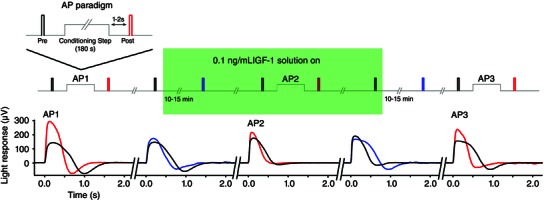
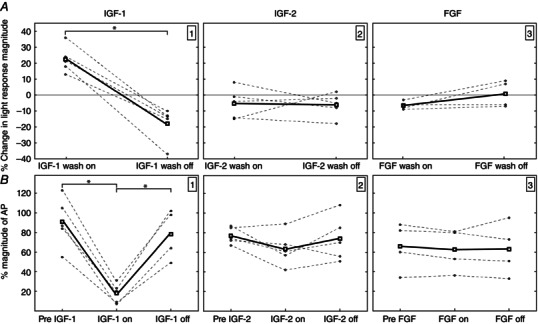
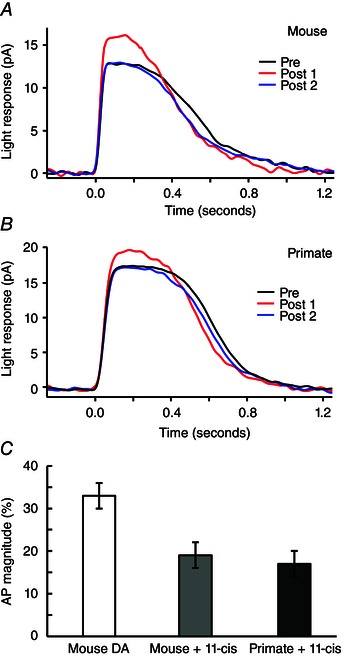
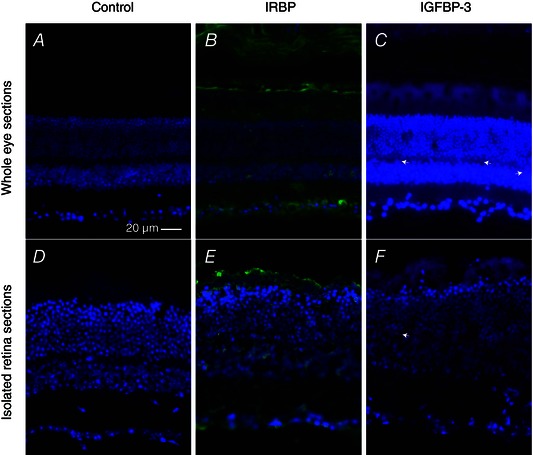
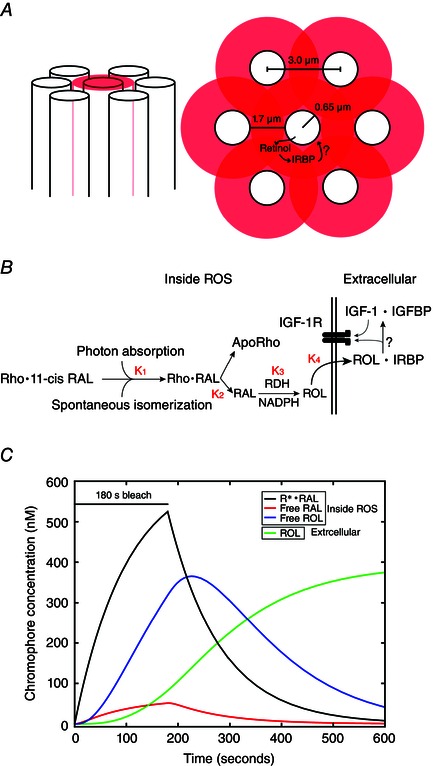
Key points: We propose that the end product of chromophore bleaching in rod photoreceptors, all-trans retinol, is part of a feedback loop that increases the sensitivity of the phototransduction cascade in rods. A previously described light-induced hypersensitivity in rods, termed adaptive potentiation, is reduced by exogenously applied all-trans retinol but not all-trans retinal. This potentiation is produced by insulin-like growth factor-1, whose binding proteins are located in the extracellular matrix, even in our isolated retina preparation after removal of the retinal pigmented epithelium. Simple modelling suggests that the light stimuli used in the present study will produce sufficient all-trans retinol within the interphotoreceptor matrix to explain the potentiation effect.

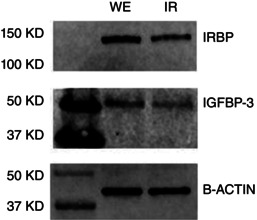
Abstract: Photoreceptors translate the absorption of photons into electrical signals for propagation through the visual system. Mammalian photoreceptor signalling has largely been studied in isolated cells, and such studies have necessarily avoided the complex environment of supportive proteins that surround the photoreceptors. The interphotoreceptor matrix (IPM) contains an array of proteins that aid in both structural maintenance and cellular homeostasis, including chromophore turnover. In signalling photon absorption, the chromophore 11-cis retinal is first isomerized to all-trans retinal, followed by conversion to all-trans retinol (ROL) for removal from the photoreceptor. Interphotoreceptor retinoid-binding protein (IRBP) is the most abundant protein in the IPM, and it promotes the removal of bleached chromophores and recycling in the nearby retinal pigment epithelium. By studying the light responses of isolated mouse retinas, we demonstrate that ROL can act as a feedback signal onto photoreceptors that influences the sensitivity of phototransduction. In addition to IRBP, the IPM also contains insulin-like growth factor-1 (IGF-1) and its associated binding proteins, although their functions have not yet been described. We demonstrate that extracellular application of physiological concentrations of IGF-1 can increase rod photoreceptor sensitivity in mammalian retinas. We also determine that chromophores and growth factors can limit the range of a newly described form of photoreceptor light adaptation. Finally, fluorescent antibodies demonstrate the presence of IRBP and IGFBP-3 in isolated retinas. A simple model of the formation and release of ROL into the extracellular space quantitatively describes this novel feedback loop.


Figures

Figure 1
Figure 1. Example experiment showing the effect of 1 nM ROL on the rod light response and AP in a single retina
The magnitude of AP was first established with the paradigm shown in the inset. The magnitude of AP was defined as the increase in the light response amplitude following 3 min of saturating illumination (AP1, black vs. red traces). The key illustrates the timing of the stimuli, as well as the application period of ROL. After a 5 min recovery from AP, a solution of ROL (1 nm in this experiment) was flowed over the retina (green shaded box) and the light response was monitored for 15 min. At 1 nm, ROL increased the amplitude of the light response and accelerated response recovery (second panel black vs. blue traces). AP was tested a second time in the presence of ROL. As a percentage, the magnitude of AP was diminished in the presence of ROL (AP2, black vs. red traces) but the peak AP increase was unchanged. The solution of ROL was then washed off for 15 min, and the light response was monitored. Washout of ROL showed a decrease in response amplitude and a deceleration of response recovery (fourth panel, black vs. blue trace). Finally, AP was tested after ROL washout, where the magnitude of AP fully recovered (AP3, black vs. red traces).
Figure 2
Figure 2. Effects of extracellular retinoids on the light response and AP magnitude
Individual retinas were exposed to a single concentration of RAL or ROL. A, the light response amplitude increased with 1 nm ROL but decreased with exposure to 1000 nm ROL or RAL. B, low‐dose retinol does not alter AP magnitude (n = 4) but all concentrations of ROL ≥1 nm decreased the magnitude of AP (1 nm: n = 6; 10 nm: n = 4; 100 nm: n = 3; 1000 nm: n = 3). There was no change in AP magnitude when the tissue was exposed to 10 nm RAL (n = 3) but 1000 nm RAL reduced AP (n = 3). The number of retinas in (B) is the same as in (A). *P < 0.01, ***P < 0.001.
Figure 3
Figure 3. Example experiment illustrating the effect of 0.1 ng ml−1 IGF‐1 on the rod light response and AP in a single retina
The magnitude of AP was first established with the light exposure paradigm (AP1, black vs. red traces). The stimulus key indicates the timing of the stimulus traces (colour coded), as well as the application of IGF‐1. After a 5 min recovery from AP, a solution containing 0.1 ng ml−1 IGF‐1 was flowed over the retina (green shaded box) and the light response was monitored for 15 min. Application of IGF‐1 increased the amplitude of the light response and accelerated response recovery (second panel, black vs. blue traces). AP was tested in the presence of IGF‐1, and the magnitude was clearly diminished in the presence of the growth factor (AP2, black vs. red traces). The solution of IGF‐1 was then washed off for 15 min, and the light response was monitored. Washout of IGF‐1 returned the light response to the control amplitude and duration (fourth panel, black vs. blue trace). Finally, AP was tested again to monitor recovery from IGF‐1 exposure (AP3, black vs. red traces).
Figure 4
Figure 4. Effect of growth factors on the light response and AP magnitude
Light responses: A; AP magnitude; B. Left: IGF‐1 (0.1 ng ml−1) increases the amplitude of the flash response during wash on and the light response decreased when washed off. Dashed lines connect individual retinas across a single experiment, whereas the solid boxes represent the mean of the individual experiments. The negative change during after wash off indicates a return of amplitude back to pre‐exposure levels. There was no effect on the light response when retinas were exposed either 10 ng ml−1 IGF‐2 (middle) or 10 ng ml−1 FGF (right). IGF‐1 reversibly decreased the amplitude of AP (B), whereas there was no affect on AP with application of IGF‐2 or FGF.
Figure 5
Figure 5. Effects of excess 11‐cis retinal on AP in single cells
A, flash responses from a light‐adapted mouse rod whose pigment was regenerated in darkness with added 11‐cis retinal. AP magnitude: red vs. black/blue traces was smaller than that reported for dark‐adapted mouse rods. B, flash responses from a light‐adapted primate rod whose visual pigment was regenerated. AP was present in each primate rod studied and similar in magnitude to the AP of mouse rods treated in a similar fashion. C, AP magnitude for a group of dark adapted mouse rods (white bar, 33 ± 3%) (McKeown & Kraft, 2014) was significantly larger (P < 0.05) than that of light adapted and regenerated rods from mouse (grey bar, 19 ± 3%, n = 4) and primate (black bar, 17 ± 1%, n = 4).
Figure 6
Figure 6. Immunohistochemistry indicates the presence of IRBP and IGFBP‐3 in both whole eyes and isolated retinas
AC, whole eyes were removed from dark‐adapted mice and the cornea was removed. Eyes were fixed, sectioned and stained for either (B) IRBP or (C) IGFBP‐3. The control slide in (A) was not exposed to primary antibody. IRBP is clearly present in the photoreceptor layers adjacent to the attached RPE. IGFBP‐3 is also present in the photoreceptor layer, and there were numerous processes in the inner plexiform layer that stained positive for IGFBP‐3 (e.g. white arrowhead). For each of the whole eye sections, exposure times (ms) were (A) DAPI, 150; Cy‐2, 55, (B) DAPI, 150; Cy‐2, 55 and (C) DAPI, 160; Cy‐2, 41. DF, retinas were isolated from dark‐adapted mice in the same manner as that used for the isolated retina ERG experiments. Retinas were then fixed, sectioned and stained for either (E) IRBP or (F) IGFBP‐3. The retina in the control slide in (D) was not exposed to primary antibodies. The proteins of interest are present in both the photoreceptor layer and the inner plexiform layer. For each of the isolated retina sections, exposure times (ms) were (D) DAPI, 62; Cy‐2, 100, (E) DAPI, 73; Cy‐2, 43 and (F) DAPI, 55; Cy‐2, 146.
Figure 7
Figure 7. Western blotting reveals IRBP and IGFBP‐3 in both whole eye and isolated retina preparations
To correlate the presence of extracellular proteins with the immunohistochemical findings in Fig. 6, we dissected eyes from five mice in the same manner as that used for the other experiments. We then homogenized the tissue and combined the protein from five whole eyes (WE) to be run alongside five combined isolated retinas (IR). Immunopositive bands were present at the expected molecular weights for both IRBP and IGFBP‐3 in both whole eye and isolated retina protein extracts. β‐actin was used as a loading control.
Figure 8
Figure 8. A model of retinol release and the possible pathways resulting in IGF‐1R activation
A, an illustration of rod spacing, with transparent red circles showing extracellular space and regions of overlap. B, reactions in the chromophore pathway. First, the conversion of rhodopsin bound to 11‐cis retinal (Rho•11‐cis RAL) to rhodopsin‐bound all‐trans retinal (Rho•RAL). K 1 represents the bleach rate that results in AP (set to 500 R* s–1). RAL dissociates from rhodopsin slowly, forming free RAL and aporhodopsin. The rate constant for this reaction was set to 5 molecules s–1. As a result of the mild nature of the bleach, the conversion of RAL to ROL by retinol dehydrogenase was assumed to occur rapidly, and K 3 was set to 30 molecules s–1. Finally, the rate of ROL leaving the cell, K 4, was assumed be accelerated by IRBP and was set at 10 molecules s–1. The reactions depicted in the extracellular space are hypothetical, and involve the interaction of IRBP with IGFBPs, resulting in the release of IGF‐1 and the activation of the IGF‐1R. C, model representing the accumulation of the bleached chromophore products during and after a 180 s bleaching exposure. Rhodopsin is activated at 500 R* s–1, and the accumulating products are bleached rhodopsin (Rho•RAL, black), RAL that has dissociated from bleached opsin (Free RAL, red), RAL that has been converted to ROL inside the cell (Free ROL, blue) and ROL that has been released into the extracellular space (ROL, green). The results of the modelled equations in (B) are converted from molecules to nm using ROS and the extracellular volume as calculated in the Methods.

Similar articles

Cited by

References

    1. Adler A & Edwards R (2000). Human interphotoreceptor matrix contains serum albumin and retinol‐binding protein. Exp Eye Res 70, 227–234. - PubMed
    1. Adler A & Martin K (1982). Retinol‐binding proteins in bovine interphotoreceptor matrix. Biochem Biophys Res Commun 108, 1601–1608. - PubMed
    1. Adler A & Spencer S (1991). Effect of light on endogenous ligands carried by interphotoreceptor retinoid‐binding protein. Exp Eye Res 53, 337–346. - PubMed
    1. Arshavsky V & Burns M (2012). Photoreceptor signaling: supporting vision across a wide range of light intensities. J Biol Chem 287, 1620–1626. - PMC - PubMed
    1. Binkert C, Landwehr J, Mary J, Schwander J & Heinrich G (1989). Cloning, sequence analysis and expression of a cDNA encoding a novel insulin‐like growth factor binding protein (IGFBP‐2). EMBO J 8, 2497–2502. - PMC - PubMed

Publication types

LinkOut - more resources