. 2016 Feb;48(2):117-25.
doi: 10.1038/ng.3471. Epub 2015 Dec 21.

Identification of significantly mutated regions across cancer types highlights a rich landscape of functional molecular alterations

Affiliations

Identification of significantly mutated regions across cancer types highlights a rich landscape of functional molecular alterations

Carlos L Araya et al. Nat Genet. 2016 Feb.

Abstract

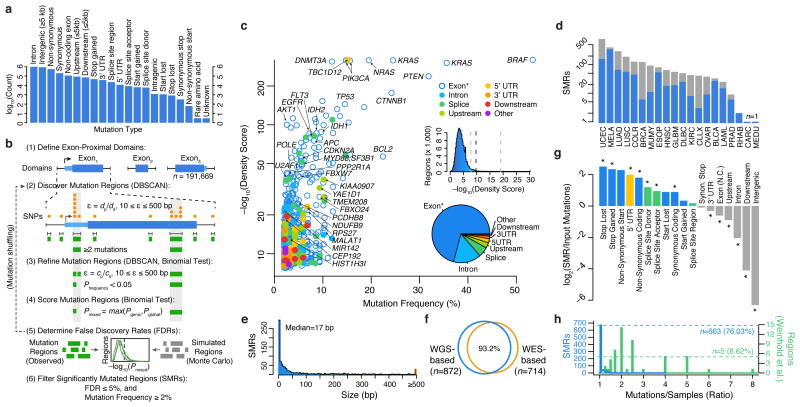
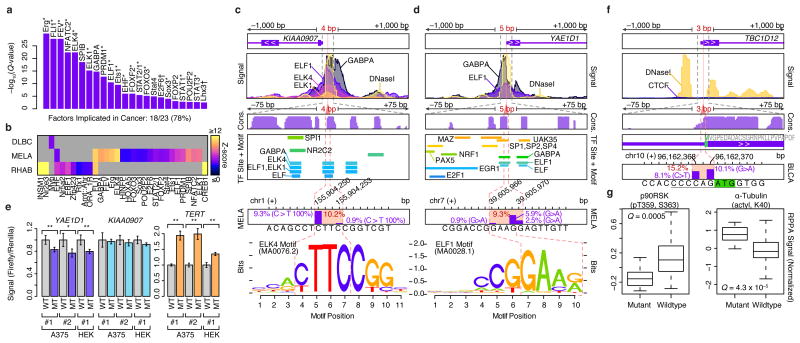
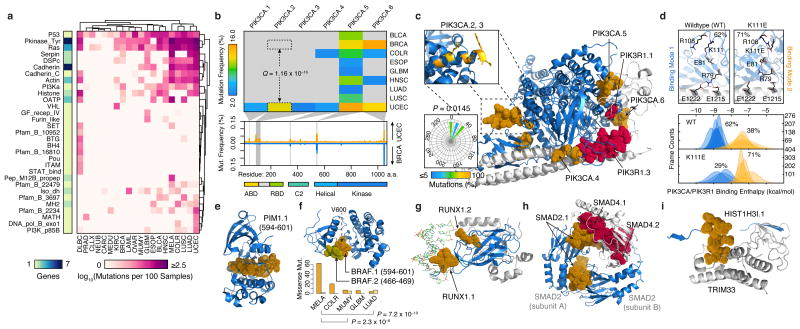
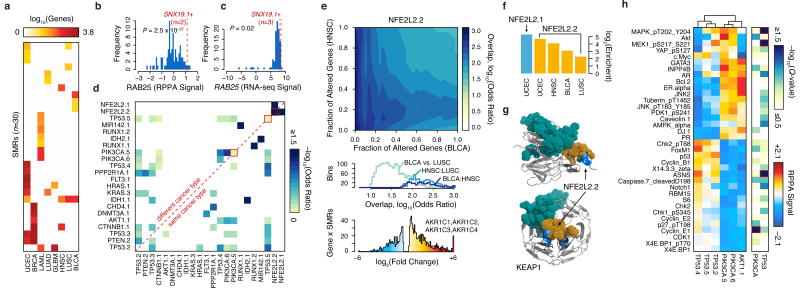
Cancer sequencing studies have primarily identified cancer driver genes by the accumulation of protein-altering mutations. An improved method would be annotation independent, sensitive to unknown distributions of functions within proteins and inclusive of noncoding drivers. We employed density-based clustering methods in 21 tumor types to detect variably sized significantly mutated regions (SMRs). SMRs reveal recurrent alterations across a spectrum of coding and noncoding elements, including transcription factor binding sites and untranslated regions mutated in up to ∼ 15% of specific tumor types. SMRs demonstrate spatial clustering of alterations in molecular domains and at interfaces, often with associated changes in signaling. Mutation frequencies in SMRs demonstrate that distinct protein regions are differentially mutated across tumor types, as exemplified by a linker region of PIK3CA in which biophysical simulations suggest that mutations affect regulatory interactions. The functional diversity of SMRs underscores both the varied mechanisms of oncogenic misregulation and the advantage of functionally agnostic driver identification.


Figures

Figure 1
Figure 1
Identification of significantly mutated regions (SMRs) in 20 cancer types across a broad spectrum of functional elements. (a) Pan-cancer distribution of mutation types in n=3,078,482 somatic single-nucleotide variant (SNV) calls. (b) Exons and exon-proximal domains (±1,000 bp) were scanned for clusters of somatic mutations (orange, DBSCAN). Distance parameter ε is dynamically defined as the average distance of mutated positions (dp) in the domain size (ds). Clusters (green) are divided if sub-clusters with higher mutation densities (P < 0.05, binomial test) are found in a second-pass analysis with ε defined as the average distance of mutated positions (cp) within the cluster of size cs (see Online Methods for density scoring and FDR calculation). (c) Per-cancer mutation frequency and density scores of discovered SMRs (color-coded by type and labelled by associated gene). The distribution of density scores in evaluated regions and SMR region types are shown in insets (middle) and (bottom), respectively. Dashed lines indicate the minimum, median, and maximum density score FDR (5%) thresholds. “Exon*” label refers to coding exons and non-coding genes. (d) Number of SMRs with FDR ≤ 5% and mutation frequency ≥2% per cancer type. Gray bars indicate SMRs with FDR ≤ 5% but mutation frequency <2%. (e) SMR size distribution. (f) Concordance between SMRs discovered by employing background models derived from whole-genome (WGS-based) or whole-exome (WES-based) sequencing. (g) Categories with significant fold change in mutation type representation between SMR-associated and input mutations are denoted (*; P < 0.01). (h) Distribution of the number of mutations per sample in SMRs (blue) and 58 (green) recurrently-altered non-coding regions.
Figure 2
Figure 2
Non-coding SMRs recurrently alter promoters and 5′ UTRs. (a) Transcription factors (TFs) with enriched (Q < 0.01) motifs in small SMRs (≤25bp) across all cancer types are shown. 18 of the 23 TFs are known cancer-associated TFs (*) or associated with cell-cycle control or developmental roles (†). (b) Cancer-specific motif enrichment analysis. (c) Gene structure, ENCODE ChIP-seq and DNaseI signals, vertebrate conservation (phastCons 100way), Factorbook TF binding sites and motif occurrences, and somatic mutation frequencies at melanoma SMRs in KIAA0907 and (d) YAE1D1 promoter regions are shown at multiple scales (±1,000, ±75, and ±7 bp). Mutation frequency within each SMR (red) and at each position (purple bars) are shown. Motifs of ETS-family binding sites that overlap the SMRs are highlighted. (e) Luciferase reporter signal from wildtype (WT) and mutant (MT) promoters in three experiments performed in melanoma (A375) and HEK 293T cells with independent plasmid DNA preps (#1-2). For each experiment, three replicates were performed. Luciferase/renilla signals are shown, and are normalized by the mean WT signal per experiment. Two asterisks denotes P < 0.05 in two-sided t-tests; one asterisk denotes P < 0.1. Error bars indicate s.d. (f) Gene-structure, ENCODE CTCF and DNaseI signals, vertebrate conservation (phastCons 100way) at the 5′ UTR TBC1D12 bladder cancer SMR are shown at multiple scales. Start codon position is highlighted in green and Kozak sequence is underlined. (g) Relative protein and post-translational modification signals of wildtype (n=78) and mutant (TBC1D12.1 SMR-altered, n=14) bladder tumors. Central band, box boundaries, and whiskers correspond to the median, the interquartile range, and the highest/lowest points within 1.5× the interquartile range, respectively.
Figure 3
Figure 3
Structural mapping of SMRs onto proteins and complexes reveals differentially-altered regions among cancers and molecular interfaces targeted by recurrent alterations. (a) Non-synonymous mutation frequency per PFAM protein domain, per cancer, per residue. Number of genes per domain is shown (left). (b) Mutation frequency matrix of PIK3CA SMRs across cancer types, and comparison of per residue mutation frequency of PIK3CA domains in endometrial (UCEC; orange) and breast cancer (BRCA; blue) samples. Gray bars indicate SMRs within PIK3CA. (c) Co-crystal structure of the PIK3CA (p110α; blue) and PIK3R1 (p85α; gray) interaction (PDB: 2RDO, 2IUG, 3HIZ). Residues within endometrial cancer SMRs on PIK3CA (orange) and PIK3R1 (red) are rendered as solvent-accessible surfaces. Insets display mutated residues within the PIK3CA.2, PIK3CA.3 SMR α-helix (yellow, top) and their corresponding side-chain dihedral angles (bottom). (d) Molecular dynamics simulations suggest PIK3CA–PIK3R1 binding is bimodal (bottom). Mutations within the PIK3CA.2, PIK3CA.3 SMR α-helix interfere with R79 binding contacts at the PIK3R1 interface, as shown in the wildtype and K111E mutant. Molecular structures of spatially-clustered (e) mutations (diffuse large B-cell lymphoma) and (f) SMRs (multiple myeloma), (g) a DNA (green) interface SMR, (h) reciprocal protein interface SMRs, and (i) a histone H3.1 SMR in the TRIM33 interface. Structural alignments and molecular visualizations prepared with PyMOL (Schrödinger). The relative proportions of BRAF.1 and BRAF.2 missense mutations per cancer type are shown in (f). PDB codes for (e-i) are 3CXW, 1UWH, 1H9D, 1U7V, and 3U5N, respectively.
Figure 4
Figure 4
SMRs are associated with distinct molecular signatures. (a) Matched RNA-seq data for nine cancers revealed that mutations in 30 distinct SMRs associated with ≥10 differentially expressed genes (FDR < 5%). (b) Normalized reverse phase protein array (RPPA) and (c) RNA-seq signals for RAB25 are plotted. Red lines indicate signals for samples with mutated SNX19 SMR. (d) Similarity between differentially expressed gene sets associated with mutations in each SMR pair. (e) Overlap between differentially expressed genes associated with altered NFE2L2.2 in bladder cancer (BLCA) and head and neck carcinoma (HNSC) is shown (top). Differentially expressed genes are sorted by p-value and similarity is quantified by Fisher's exact test odds ratio. The distribution of odds ratios of similarity is summarized for three comparisons (middle). Samples with NFE2L2.2 mutations exhibit highly increased expression of aldo-keto reductase enzymes (bottom). (f) The relative enrichment for oxidoreductase activity (GO:0016616) for specific cancer types (Supplementary Table 13). (g) Structure of SMR NFE2L2.2 (orange) in the KEAP1-binding domain (PDB: 3WN7). A sector of recurrent alterations on KEAP1 (teal) did not pass our 2% frequency cutoff. (h) Breast cancer patients were grouped by mutations in six SMRs in PIK3CA, AKT1, and TP53. Normalized RPPA-based expression was obtained from The Cancer Proteome Atlas (TCPA). The median RPPA signal for 36 markers and q-value (Kruskal-Wallis test) of differential expression between SMRs of TP53 or of PIK3CA are plotted (red highlights markers with significant intragenic differences, Q < 0.05).
Figure 5
Figure 5
Structure in the distribution of cancer mutations remains largely uncharacterized. Gini coefficients of dispersion were calculated as the fraction of non-synonymous mutations contained per residue, across ∼19,000 proteins. (a) Lorenz curves (top-left), Gini-coefficients (top-right), and their correlation with tumor sample numbers (bottom) are shown. (b) Gini coefficients of non-synonymous mutation frequency in breast cancer as a function of (bootstrapped) sample size. Line of exponential fit is shown in dark blue. For comparisons between cancer types (a), the Gini coefficients were computed exclusively on the 100 most mutated residues per cancer.

References

    1. Hodis E, et al. A landscape of driver mutations in melanoma. Cell. 2012;150:251–263. - PMC - PubMed
    1. Huang FW, et al. Highly recurrent TERT promoter mutations in human melanoma. Science. 2013;339:957–959. - PMC - PubMed
    1. Alexandrov LB, et al. Signatures of mutational processes in human cancer. Nature. 2013;500:415–421. - PMC - PubMed
    1. Lawrence MS, et al. Mutational heterogeneity in cancer and the search for new cancer-associated genes. Nature. 2013;499:214–218. - PMC - PubMed
    1. Lawrence MS, et al. Discovery and saturation analysis of cancer genes across 21 tumour types. Nature. 2014;505:495–501. - PMC - PubMed

Publication types