. 2016 Mar;1861(3):177-87.
doi: 10.1016/j.bbalip.2015.12.005. Epub 2015 Dec 12.

BRET-monitoring of the dynamic changes of inositol lipid pools in living cells reveals a PKC-dependent PtdIns4P increase upon EGF and M3 receptor activation

Affiliations

BRET-monitoring of the dynamic changes of inositol lipid pools in living cells reveals a PKC-dependent PtdIns4P increase upon EGF and M3 receptor activation

József T Tóth et al. Biochim Biophys Acta. 2016 Mar.

Abstract

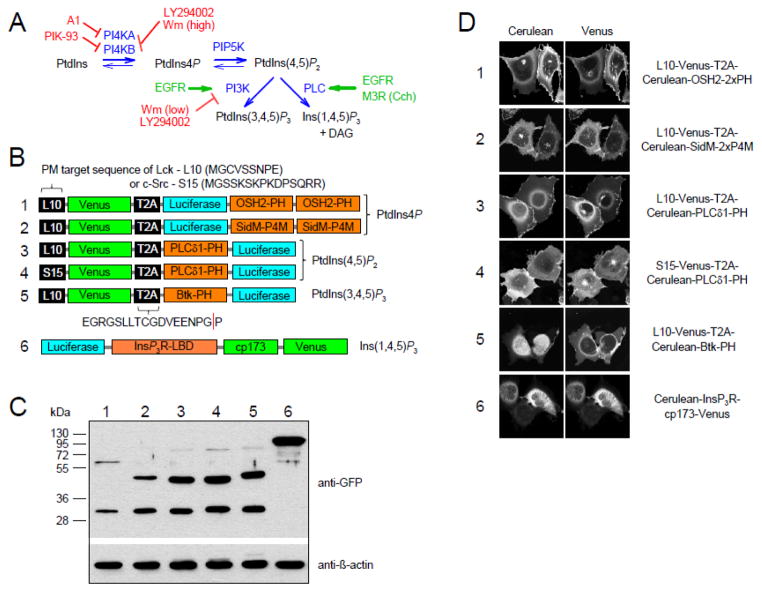
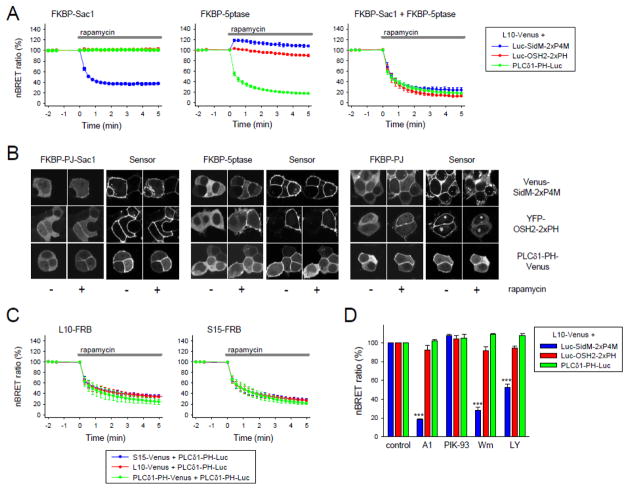
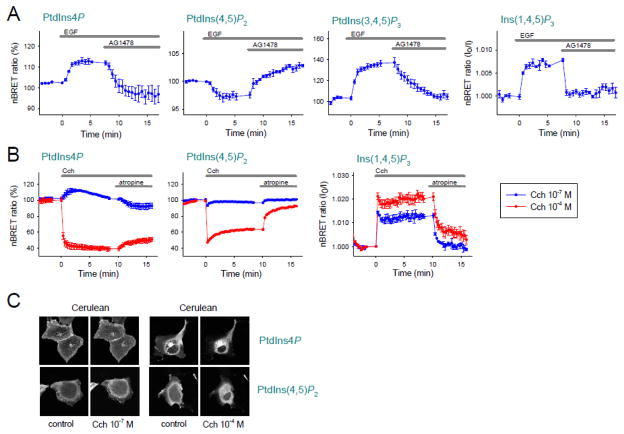
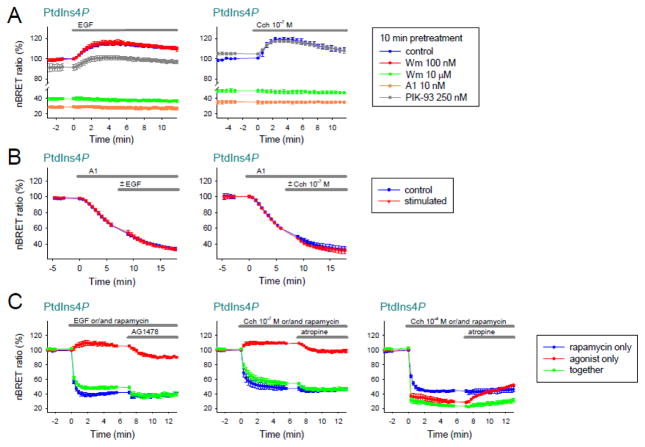
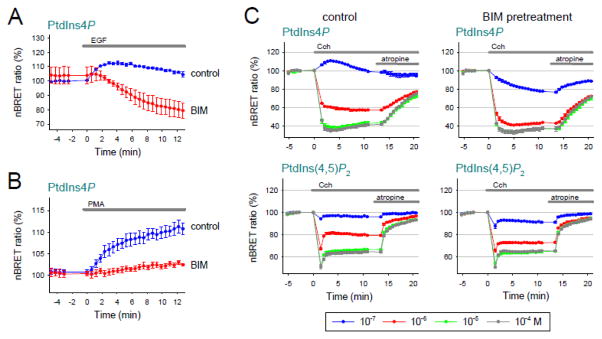
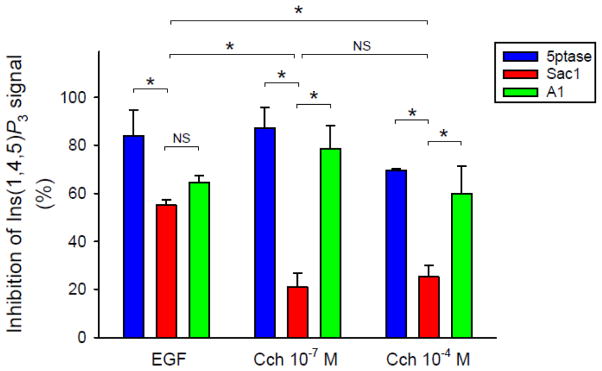
Deciphering many roles played by inositol lipids in signal transduction and membrane function demands experimental approaches that can detect their dynamic accumulation with subcellular accuracy and exquisite sensitivity. The former criterion is met by imaging of fluorescence biosensors in living cells, whereas the latter is facilitated by biochemical measurements from populations. Here, we introduce BRET-based biosensors able to detect rapid changes in inositol lipids in cell populations with both high sensitivity and subcellular resolution in a single, convenient assay. We demonstrate robust and sensitive measurements of PtdIns4P, PtdIns(4,5)P2 and PtdIns(3,4,5)P3 dynamics, as well as changes in cytoplasmic Ins(1,4,5)P3 levels. Measurements were made during either experimental activation of lipid degradation, or PI 3-kinase and phospholipase C mediated signal transduction. Our results reveal a previously unappreciated synthesis of PtdIns4P that accompanies moderate activation of phospholipase C signaling downstream of both EGF and muscarinic M3 receptor activation. This signaling-induced PtdIns4P synthesis relies on protein kinase C, and implicates a feedback mechanism in the control of inositol lipid metabolism during signal transduction.

Keywords: BRET; EGF receptor; GPCR; PI4-kinase; PKC; Phosphoinositides.


Figures

Figure 1
Figure 1. Characterization of the newly developed energy transfer based phosphoinositide biosensors
(A) During the synthesis of PtdIns(4,5)P2, the PI4K enzymes phosphorylates the PtdIns, and then PIP5K produces PtdIns(4,5)P2 from PtdIns4P. In muscarinic M3 receptor (M3R) expressing HEK 293T cells, PLC activity is stimulated with carbachol (Cch). In EGF receptor expressing cells, EGF stimulus leads to PI3K and PLC activation and thus to the production of PtdIns(3,4,5)P3 and Ins(1,4,5)P3 simultaneously. The applied inhibitors are indicated in red. (B) Schematic representations of domain structures of the different phosphoinositide biosensors. L10 and S15 represent plasma membrane (PM) target sequence of Lck and c-Src, while T2A is a viral protein sequence. The sequence is transcribed as a single mRNA molecule, but translation is interrupted between the two amino acids indicated by the red line, resulting in two separate polypeptide chains. (C) The biosensors (containing Cerulean instead of luciferase) were expressed in HEK 293T cells, then the fluorescent protein-tagged PM markers and lipid binding domains were resolved by SDS-PAGE, and analyzed by Western blotting with anti-GFP antibodies. Anti-β-actin was used as control. The positions of molecular mass markers are indicated to the left of the Western blot. Numbers above the blot indicate the sensors in the same order as marked on Fig. 1B. (D) Representative confocal images of COS-7 cells expressing the indicated biosensors. Note that because Cos-7 cells are flat the curvature of the PM around the nucleus can be similar to the nuclear envelope and PM can be misinterpreted as cytoplasm.
Figure 2
Figure 2. Reduction of the PM PtdIns4P and PtdIns(4,5)P2 and their effect on the BRET signal of the indicated biosensors
(A) The PM PtdIns4P or PtdIns(4,5)P2 pool were decreased with the help of the rapamycin induced heterodimerization assay [25], where Sac1 cleaved the phosphate from the 4′ position and 5-ptase cleaved from the 5′ position of inositol ring. The curves show the changes in the nBRET ratio of the indicated sensors upon addition of 300 nM rapamycin. Values are expressed as percent of the initial BRET ratio measured in untreated cells [mean ± standard error of the mean (SEM) of three independent experiments]. For the calculation of the nBRET ratio see Materials and Methods. (B) Representative images of HEK 293T cells expressing the indicated PPIn-binding domains and the enzymes of the rapamycin induced heterodimerization assay that was targeted to L10-FRB (for single cell measurements we used the T2A version of it to make sure that the cells express both proteins of the lipid depletion system [23]). Left columns of each block show the initial localization of the mRFP-tagged enzymes or the Venus-tagged PPIn-binding domains, while the right columns show their localization after 5 minutes treatment with 300 nM rapamycin. (C) Changes in the nBRET ratio of the different PLCδ1-PH domain containing biosensors, if 5-ptase were targeted to raft (L10-FRB) or non-raft (S15-FRB) regions of the PM. Values are means ± SEM of three independent experiments. (D) Effects of 10 minutes incubation with 10 nM A1, 250 nM PIK-93, 10 μM wortmannin (Wm) or 100 μM LY294002 on the nBRET ratio of the different biosensors. Data are means ± SEM of three independent experiments. One-way ANOVA and Bonferrini t-test were made for statistical analysis, ***p<0.001.
Figure 3
Figure 3. Changes in the PM phosphoinositide levels upon EGF or carbachol stimulation
(A and B) Normalized BRET ratios corresponding to PM PtdIns4P, PtdIns(4,5)P2 PtdIns(3,4,5)P3 and cytoplasmic Ins(1,4,5)P3 levels are shown upon EGF (100 ng/ml) (A) or carbachol stimulation (10−7 or 10−4 M) (B). HEK 293T cells transiently express EGFR or M3R and the different biosensors [SidM-2xP4M for PtdIns4P, PLCδ1-PH for PtdIns(4,5)P2, Btk-PH for PtdIns(3,4,5)P3 and InsP3R-LBD for Ins(1,4,5)P3]. After 8 minutes EGFR inhibitor AG1478 (10 μM) or M3R competitive antagonist atropine (10 μM) were added. In case of the Ins(1,4,5)P3 sensor, I0/I nBRET ratio were calculated as described previously [24]. Values are means ± SEM of three independent experiments. (C) Representative confocal images of COS-7 cells expressing the Cerulean version of biosensors used on Panel B. Images show the localization of the PPIn binding domains before (left columns) and 5 min after carbachol (10−7 or 10−4 M) stimulation (right columns).
Figure 4
Figure 4. Investigation of the mechanism of agonist-induced PM PtdIns4P elevation
(A) HEK 293T cells expressing either EGFR or M3R were pretreated with the indicated inhibitors for 10 minutes and then stimulated with EGF (100 ng/ml) or Cch (10−7 M). Changes of the PtdIns4P levels were monitored with the BRET PtdIns4P biosensor (SidM-2xP4M). Values are means ± SEM of three independent experiments. (B) HEK 293T cells expressing either EGFR or M3R were treated with A1 (10 nM) for 5 minutes and then with EGF (100 ng/ml) or Cch (10−7 M). Changes of the PtdIns4P levels were monitored with the BRET PtdIns4P biosensor (SidM-2xP4M). Values are means ± SEM of three independent experiments. (C) Cells were transfected with EGFR or M3R, the PtdIns4P biosensor, and the rapamycin induced PtdIns4P depletion system. At time 0, cells got either rapamycin (300 nM) (blue traces) or receptor agonists (EGF 100 ng/ml; Cch 10−7 M or Cch 10−4 M) (red traces) or both (green traces). After 7 minutes EGFR inhibitor AG1478 (10 μM) or M3R competitive antagonist atropine (10 μM) were added. Changes of the PtdIns4P levels were monitored with the BRET PtdIns4P biosensor (SidM-2xP4M). Values are means ± SEM of three independent experiments.
Figure 5
Figure 5. The role of PKC in the increasing PM PtdIns4P levels and in the maintenance of PM PtdIns(4,5)P2 upon hormonal stimulation
(A) BRET measurement with the PtdIns4P biosensor (SidM-2xP4M) in HEK 293T cells expressing EGFR. 10 minutes incubation with BIM (2 μM) was used to block PKC activity (red curve) while control cells got vehicle medium (blue curve). At time 0, cells were treated with 100 ng/ml EGF. Values are means ± SEM of three independent experiments. (B) In a similar experiment, instead of the hormonal stimulus the cells were stimulated with PMA (1 μM) to activate PKC. Values are means ± SEM of three independent experiments. (C) Simultaneous measurement of PM PtdIns4P (with SidM-2xP4M) and PtdIns(4,5)P2 (with PLCδ1-PH) levels with our BRET biosensors in HEK 293T cells expressing M3R. Left panels show the changes of the lipid levels under control circumstances while right panels demonstrate the nBRET changes in those cells which were pretreated with BIM (2 μM, 10 min). Four different concentrations of Cch (10−7 M, 10−6 M, 10−5 M and 10−4 M Cch) were used as hormonal stimuli and are shown in blue, red, green and grey respectively. 12 minutes later all cells got 10 μM atropine. Values are means ± SEM of three independent experiments.
Figure 6
Figure 6. The role of PtdIns4P and PtdIns(4,5)P2 in maintaining the hormone-induced Ins(1,4,5)P3 signal
Cells expressing EGFR or M3R, the Ins(1,4,5)P3 biosensor and the heterodimerization based lipid depletion system, which contained either mRFP-tagged Sac1 or 5-ptase. The cells were first stimulated with the indicated concentration of hormones. In 6 minutes 300 nM rapamycin or 10 nM A1 were added to the cells. For the individual curves see Fig. S4. The graph shows the percentage of the inhibition of Ins(1,4,5)P3 signal, measured at 5 or 10 minutes after the addition of rapamycin or A1, respectively. Note, that the inhibition is plotted and not the response. Values are means ± SEM of three independent experiments, two-way ANOVA and Holm-Sidak post hoc test were made for statistical analysis, *p<0.05, NS means not significant.

References

    1. Sasaki T, Takasuga S, Sasaki J, Kofuji S, Eguchi S, Yamazaki M, Suzuki A. Mammalian phosphoinositide kinases and phosphatases. Prog Lipid Res. 2009;48:307–343. - PubMed
    1. Balla T. Phosphoinositides: tiny lipids with giant impact on cell regulation. Physiol Rev. 2013;93:1019–1137. - PMC - PubMed
    1. Berridge MJ. Inositol trisphosphate and diacylglycerol as second messengers. Biochem J. 1984;220:345–360. - PMC - PubMed
    1. Di Paolo G, De Camilli P. Phosphoinositides in cell regulation and membrane dynamics. Nature. 2006;443:651–657. - PubMed
    1. Traynor-Kaplan AE, Harris AL, Thompson BL, Taylor P, Sklar LA. An inositol tetrakisphosphate-containing phospholipid in activated neutrophils. Nature. 1988;334:353–356. - PubMed

Publication types

MeSH terms