. 2016 Feb;17(2):196-203.
doi: 10.1038/ni.3326. Epub 2015 Dec 21.

Self-reactive IgE exacerbates interferon responses associated with autoimmunity

Affiliations

Self-reactive IgE exacerbates interferon responses associated with autoimmunity

Jill Henault et al. Nat Immunol. 2016 Feb.

Abstract

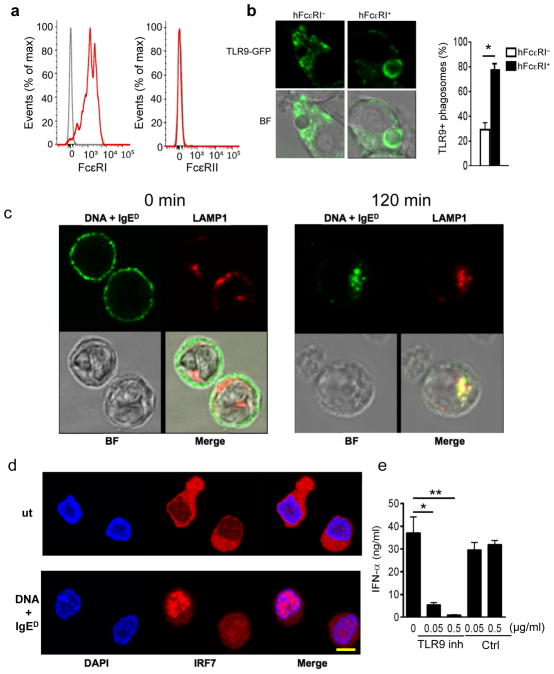
Canonically, immunoglobulin E (IgE) mediates allergic immune responses by triggering mast cells and basophils to release histamine and type 2 helper cytokines. Here we found that in human systemic lupus erythematosus (SLE), IgE antibodies specific for double-stranded DNA (dsDNA) activated plasmacytoid dendritic cells (pDCs), a type of cell of the immune system linked to viral defense, which led to the secretion of substantial amounts of interferon-α (IFN-α). The concentration of dsDNA-specific IgE found in patient serum correlated with disease severity and greatly potentiated pDC function by triggering phagocytosis via the high-affinity FcɛRI receptor for IgE, followed by Toll-like receptor 9 (TLR9)-mediated sensing of DNA in phagosomes. Our findings expand the known pathogenic mechanisms of IgE-mediated inflammation beyond those found in allergy and demonstrate that IgE can trigger interferon responses capable of exacerbating self-destructive autoimmune responses.


Figures

Figure 1
Figure 1. Anti-dsDNA IgE autoantibodies contribute to IFN response in SLE
(a) Serum concentrations of dsDNA-specific IgE in SLE patients (n = 180), atopic dermatitis patients (AD, n = 24) and healthy donors (HD, n = 26) as measured by ELISA. (b) SLE patients were grouped by SLE Disease Activity Index (SLEDAI). Concentrations of dsDNA-specific IgEs in SLE patients is shown for healthy donors (HD, n = 26), inactive (SLEDAI = 0, n = 25), mild (SLEDAI > 0 to <4, n = 87) and active (SLEDAI ≥ 4, n = 66) disease. Mean ± s.e.m. for each group is shown in red. (c) Serum concentrations of dsDNA-specific IgEs and complement component 3 (C3) from SLE patients (n = 98), as measured by ELISA and quantitative multiplexed immunoassay, respectively. Correlation was evaluated using the Spearman’s rank test (r=−0.345, p<0.0001). (d) Human PBMCs were stimulated with 20% serum from patients that had tested positive for dsDNA-specific IgE (n = 7) in the presence of an antibody that interferes with the binding of IgE to its receptors (anti-IgE), an isotype control antibody (Isotype), or no antibody. IFN-α was then measured in supernatants. Paired data are presented as percentage of response compared to the no antibody treatment. * P < 0.001.
Figure 2
Figure 2. DNA-IgE ICs trigger IFN-α secretion from pDCs
(a) Purified pDCs were stimulated with increasing concentrations of monoclonal IgED or with monoclonal isotype IgE control (IgEI) in combination with 0.5 μg/ml DNA. Data are presented as mean ± s.d. and are representative of three independent experiments. * P < 0.05. (b) IFN-α in supernatants of pDCs untreated (ut) or stimulated with 0.5 μg/ml DNA, 20 μg/ml of IgED or IgEI alone or in combination, as measured by ELISA. IgGD + DNA was used as a positive control. Aggregated IgEI (Agg IgEI) was used to activate FcεRI in the absence of DNA. Data are presented as mean ± s.d. and are representative of three independent experiments. (c) pDCs were stimulated with DNA in combination with IgGD or IgED as indicated. Cells were additionally treated with increasing concentrations of the blocking anti-IgE antibody or an isotype control (Isotype). Data are presented as mean ± s.e.m. from five independent experiments. ** P < 0.001.
Figure 3
Figure 3. IgE-containing ICs deliver DNA to TLR9 at the phagosome
(a) Flow cytometry analysis of cell surface expression of FcεRI and FcεRII (red line) in pDCs compared isotype control (grey line). Data are representative of 3 independent experiments. (b) Mouse macrophages expressing TLR9-GFP and the alpha chain of human FcεRI (hFcεRI+) were fed with beads coated with DNA+IgED. TLR9-GFP localization in hFcεRI+ and control macrophages (hFcεRI) was visualized by confocal microscopy 30 min. after bead internalization. Yellow arrows point to ingested beads. TLR9+ phagosomes were quantified (n = 75 phagosomes per/group from three independent experiments). Data are presented as mean ± s.d. (c) Human pDCs were incubated with DNA+IgED for 30 min. at 4°C (0 min) and then transferred to 37°C for 120 min. (120 min.). DNA+IgED (green) and LAMP1 (red) intracellular localization was visualized by confocal microscopy and frames from one representative experiment out of three are shown. BF = bright field. Scale bars, 5μm. (d) Human pDCs were incubated for 5 h at 37°C in the presence of DNA+IgED or untreated (ut). IRF7 intracellular localization was visualized by immunostaining using confocal microscopy. Frames from one representative experiment out of three are shown. (e) pDCs were stimulated with DNA+IgED in the presence of 0.05 or 0.5 μg/ml of TLR9 oligodeoxynucleotide (ODN) inhibitor (TLR9 inhib) or control ODN (Control). After 16 h, IFN-α was measured by ELISA in supernatants. Data are presented as mean ± s.e.m. from three independent. * P < 0.01, ** P < 0.001.
Figure 4
Figure 4. Deposition of IgE autoantibodies in lupus nephritis
(a) Serum concentration of dsDNA-specific IgE was measured in subgroups of SLE patients by ELISA. The subgroup tested were HD (n = 26), Discoid Lupus (DL, n = 25), Lupus-associated Thrombocytopenia (Thrombo, n = 23), Acute Cutaneous Lupus (ACL, n = 47), Lupus-associated Secondary Sjogren’s (sSS, n = 22), and Lupus Nephritis (LN, n = 63). Data are presented as mean ± s.e.m. The percentage of patients positive for dsDNA-specific IgE (% pos) for each disease subgroup is indicated in red. (b) Prevalence of dsDNA-specific IgE in focal LN or Class III (LN III; n = 18), diffuse LN or Class IV (LN IV; n = 22), and membranous LN or Class V (LN V; n = 23). Data are presented as mean ± s.e.m. * P < 0.001. The Percentage of patients positive for dsDNA-specific IgE is indicated in red for each LN subgroup. (c) Immunofluorescence stainings in frozen kidney biopsies. Representative staining of IgG (blue), IgE (green), pDCs (BDCA-2, red), and IFN-α-induced protein MxA (light blue) in normal and LN kidney biopsies. Yellow arrows indicate glomerular area. Images are representative for 11 LN and 5 normal kidneys biopsies.
Figure 5
Figure 5. dsDNA-specific IgE induces pDC-mediated PC differentiation
(a) pDCs (BDCA-2, red) and B cells (CD20, green) were found in close proximity in the tubular area in kidney in 2 out of 3 LN biopsies examined. A representative frame is shown. Scale bar, 20 μm. (b–e) Flow cytometry analysis of B cells and PC numbers from pDC/B cell co-cultures left untreated in media (Med) or stimulated for 7 days with DNA+IgED. B cells were defined as CD123 CD19+ cells and PCs were defined as CD123CD19+ CD27hi CD38hi cells. B cell (b) and PC cells (c) from pDC/B cell co-cultures were quantified as the number of cells acquired for a fixed amount of time per well. (d) IgM in pDC/B cell co-culture supernatants was measured by ELISA at day 7 after stimulation with DNA+IgED. (e) Flow cytometry analysis of PC numbers in pDC/B cell co-cultures stimulated with DNA+IgED in the presence of a blocking antibody specific to human IFNAR (anti-IFNAR), an IL-6-specific antibody (anti-IL-6) or an isotype control (Iso). Data are presented as mean ± s.d. of at least three independent. For the pDC-B cell co-culture experiments, means were compared by using Student’s t-test. * P < 0.001; ** P < 0.05.
Figure 6
Figure 6. Synergistic stimulation of pDCs by IgE and IgG immune complexes
(a) Serum concentrations of dsDNA-specific IgE and IgG in SLE patients (n = 98). Correlation was evaluated using the Spearman’s rank test. (b) IFN-α production by pDCs stimulated for 16 h with DNA-ICs containing increasing concentrations of IgED and IgGD. Data are presented as mean ± s.d. and are representative of seven independent experiments. Intracellular expression of IFN-α (c) and TNF (d) in pDCs stimulated with DNA-ICs. Data are presented as mean ± s.e.m. of four independent experiments. (e) Representative plots of IFN-α and TNF expression 6 h after pDC stimulation. (f) Surface expression of CD83, CD86 and CCR7 on pDCs stimulated for 16 h with DNA-ICs. Representative histograms are shown (top panels) and fold increase of mean fluorescence intensity (MFI) over untreated cells are presented as mean ± s.e.m. of five independent experiments (lower panels). (g) pDCs migration in response to CCR7 ligands (CCL19/CCL21) was assessed after stimulation with DNA-ICs for 16 h.. Data are presented as mean ± s.e.m. of migrating pDC numbers from four independent experiments. (h) IFN-γ in supernatants of cytomegalovirus (CMV) peptide-loaded pDCs stimulated with DNA-ICs for 4 h and co-cultured with CMV-responsive CD8 T cells for 48 h. Data are presented as mean ± s.e.m. of three independent experiments. (i) Proliferation of CMV-specific CD8 population after 4 days of co-culture. Histograms displayed are from one representative donor out of three. * P < 0.01, ** P < 0.05.
Figure 7
Figure 7. dsDNA-specific IgE enhance pDC interferon responses through increased DNA phagocytosis
(a) Serum concentration of dsDNA-specific IgG and dsDNA-specific IgE in SLE patients that tested positive for dsDNA-specific IgE (n = 98). Mean values were 88.0 μg/ml for DNA-IgG and 4.8 μg/ml for DNA-IgE. Mean ± s.e.m are represented in red. (b) IFN-α in supernatants of pDCs stimulated with DNA-ICs containing a fixed amount of IgGD (10 μg/ml) and DNA (0.5 μg/ml) and increasing concentrations (as indicated in x-axis) of IgED for 16 h. The ratio IgED/IgGD in the immune complexes for each of the condition is indicated in red above each bar. Data are presented as fold increase over pDCs treated with ICs containing IgGD and DNA (red dotted line) and are mean ± s.e.m. of three independent experiments. (c) IFN-α in supernatants of pDCs treated with by biotinylated RNP (RNP) and biotinylated IgG, IgE or IgG + IgE in the presence of streptavidin to form RNA-containing immune complexes. Cells were incubated with the ICs for 16 h. Data are presented as mean ± s.e.m. of four independent experiments. (d) IFN-α in supernatant of pDCs treated with similar RNA immune complexes containing a fixed amount of IgG (10 μg/ml) and DNA (0.5 μg/ml) and increasing concentrations of IgE as indicated. The ratio IgED/IgGD in the immune complexes for each of the condition is indicated in red above each bar. Data are represented as fold increase over the IFN-α obtained from cells treated with RNA-ICs containing IgG only (red dotted line). Data are presented as mean ± s.e.m. of five independent experiments. (e) Internalized DNA in pDCs treated with DNA-ICs. Representative frames from three independent experiments are shown. Scale bar = 5.0 μm. (f) Engulfment of DNA was quantified by FACS and the percentage of cells that were positive for phagocyted DNA is represented. Data are presented as mean ± s.e.m. from seven independent experiments. (g) DNA-ICs containing the indicated IgED/IgGD ratio were fed to pDCs. Percentage of pDCs positive for engulfed DNA was measured by FACS. Data represent fold increase over cells incubated with DNA+ IgGD (open circle) and are presented as mean ± s.e.m. of five independent experiments. * P < 0.05.

Comment in

References

    1. Ronnblom L, Elkon KB. Cytokines as therapeutic targets in SLE. Nature reviews Rheumatology. 2010;6:339–347. - PubMed
    1. Lateef A, Petri M. Unmet medical needs in systemic lupus erythematosus. Arthritis Res Ther. 2012;14(Suppl 4):S4. - PMC - PubMed
    1. Ronnblom L, Alm GV. A pivotal role for the natural interferon alpha-producing cells (plasmacytoid dendritic cells) in the pathogenesis of lupus. J Exp Med. 2001;194:F59–63. - PMC - PubMed
    1. Rowland SL, et al. Early, transient depletion of plasmacytoid dendritic cells ameliorates autoimmunity in a lupus model. J Exp Med. 2014;211:1977–1991. - PMC - PubMed
    1. Gilliet M, Cao W, Liu YJ. Plasmacytoid dendritic cells: sensing nucleic acids in viral infection and autoimmune diseases. Nat Rev Immunol. 2008;8:594–606. - PubMed

Publication types

MeSH terms