Clinical Trial
. 2016 Apr;46(4):1030-46.
doi: 10.1002/eji.201546005. Epub 2016 Jan 21.

Interleukin-1 antagonism moderates the inflammatory state associated with Type 1 diabetes during clinical trials conducted at disease onset

Collaborators, Affiliations
Clinical Trial

Interleukin-1 antagonism moderates the inflammatory state associated with Type 1 diabetes during clinical trials conducted at disease onset

Susanne M Cabrera et al. Eur J Immunol. 2016 Apr.

Abstract

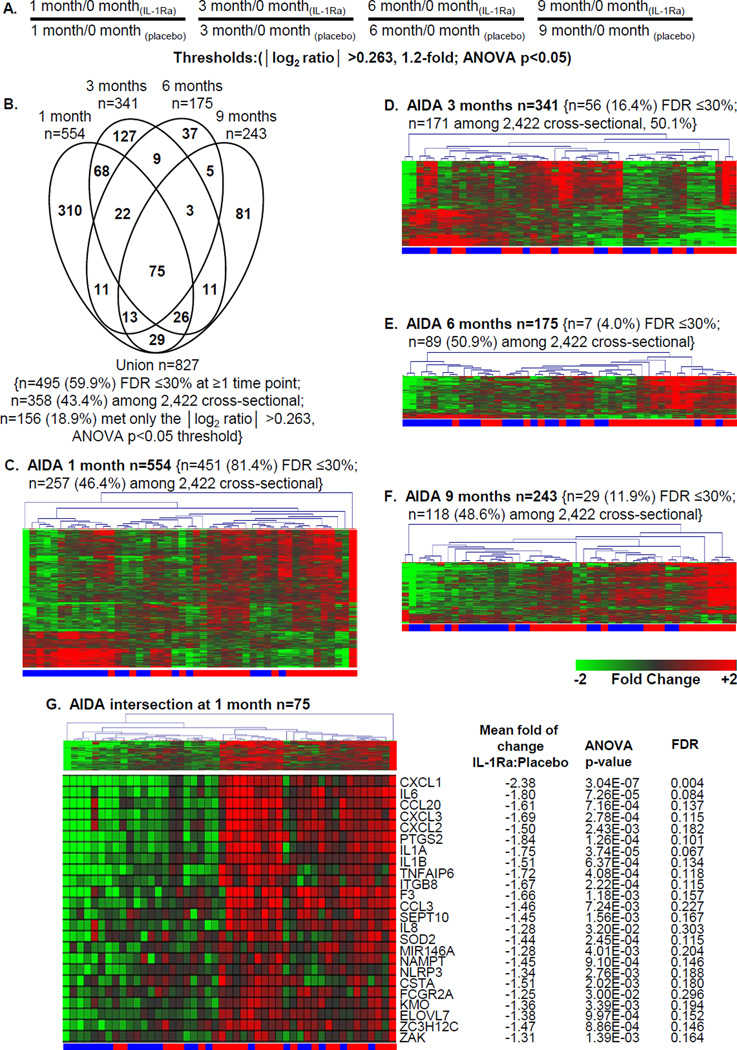
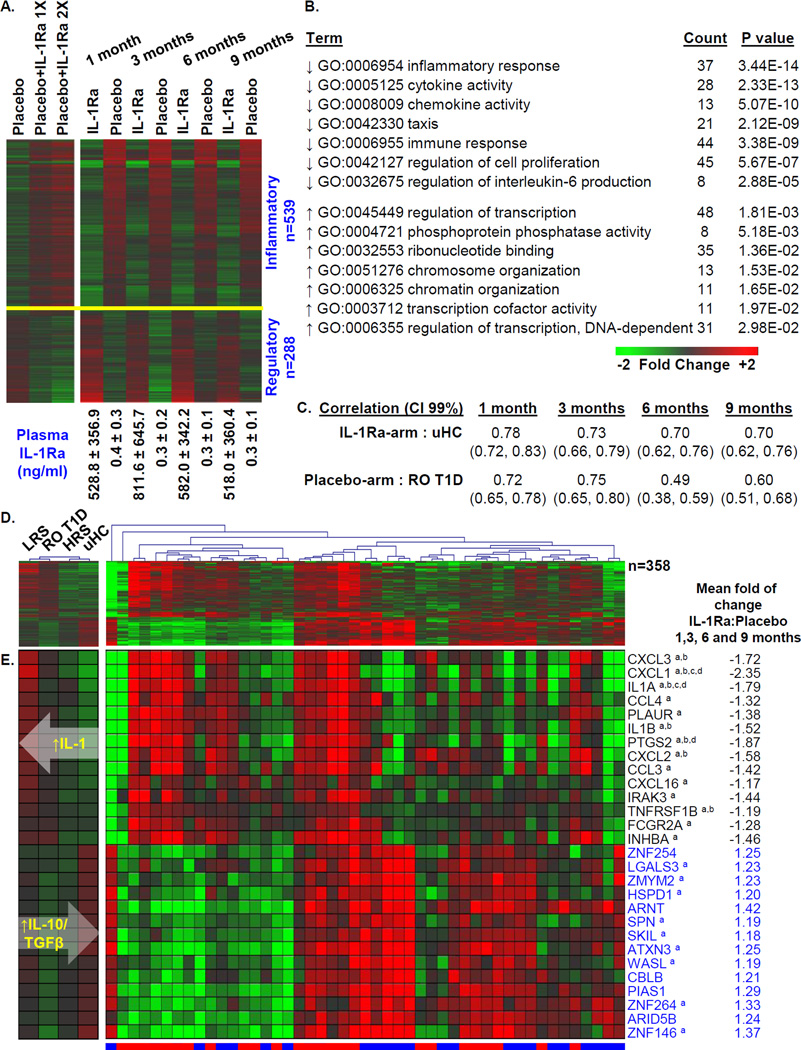
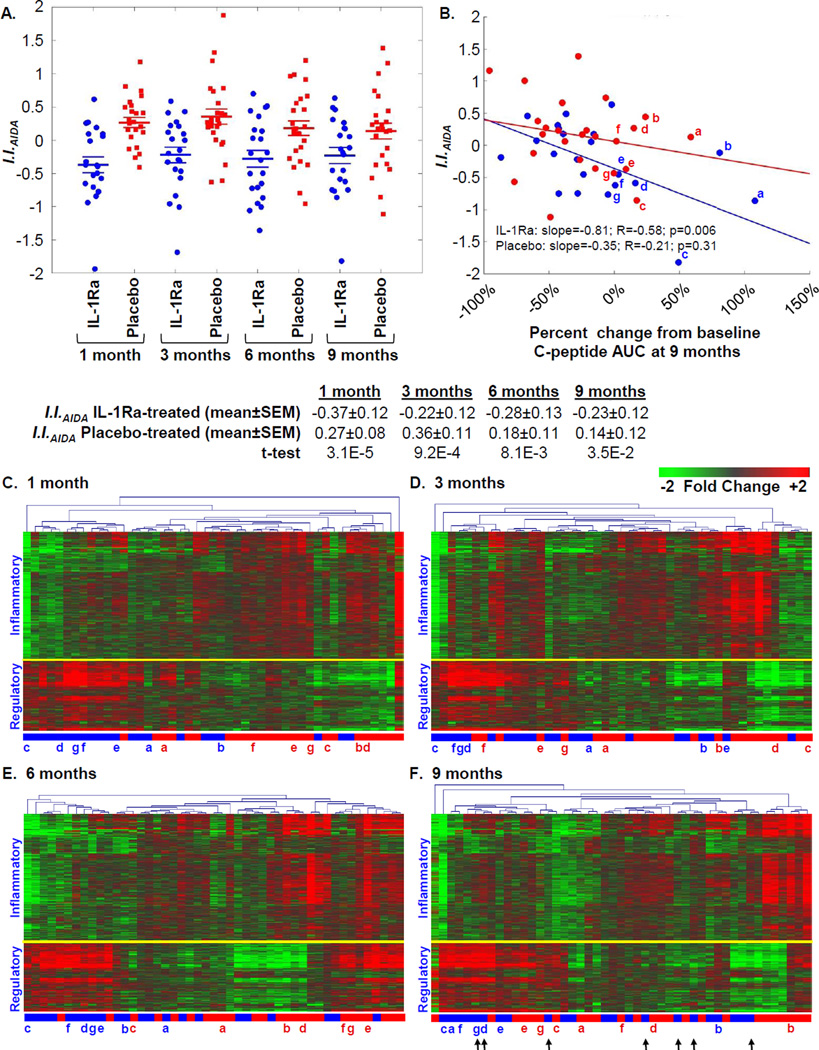
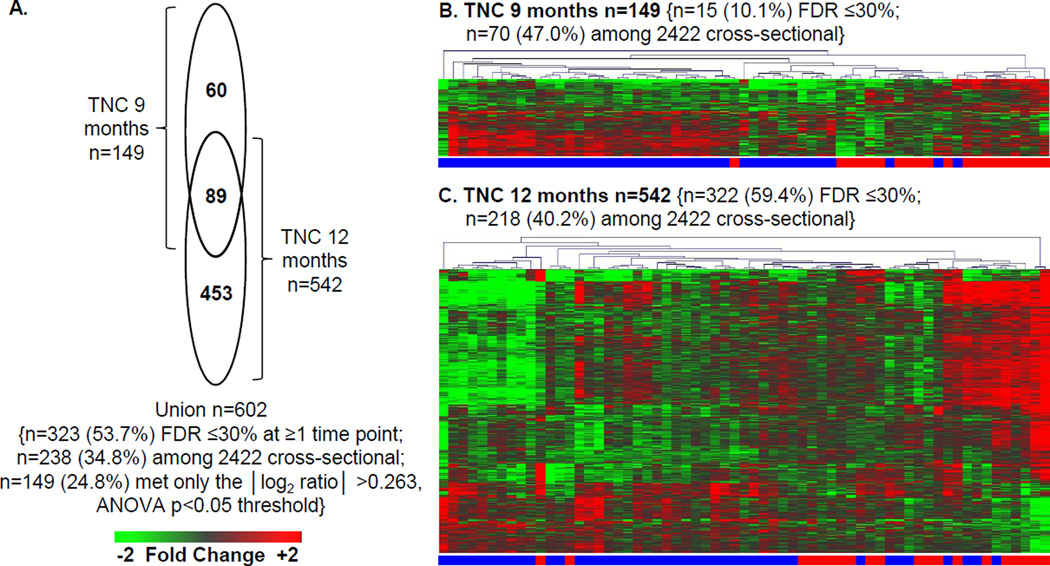
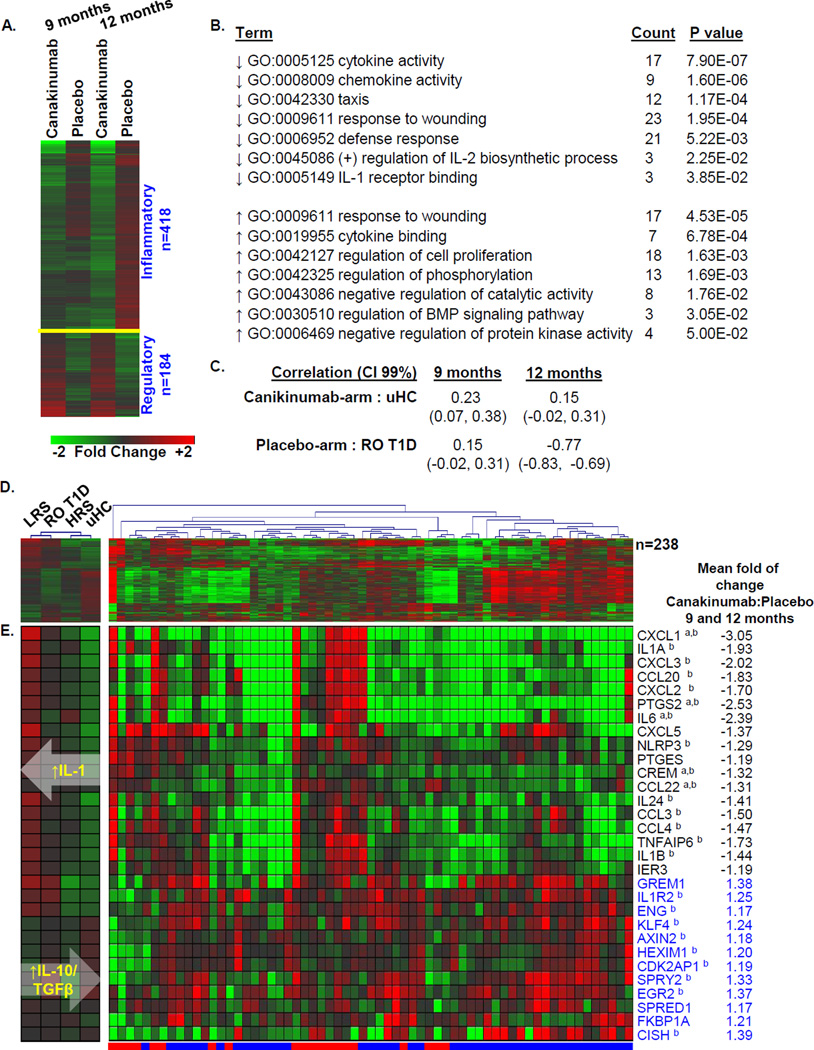
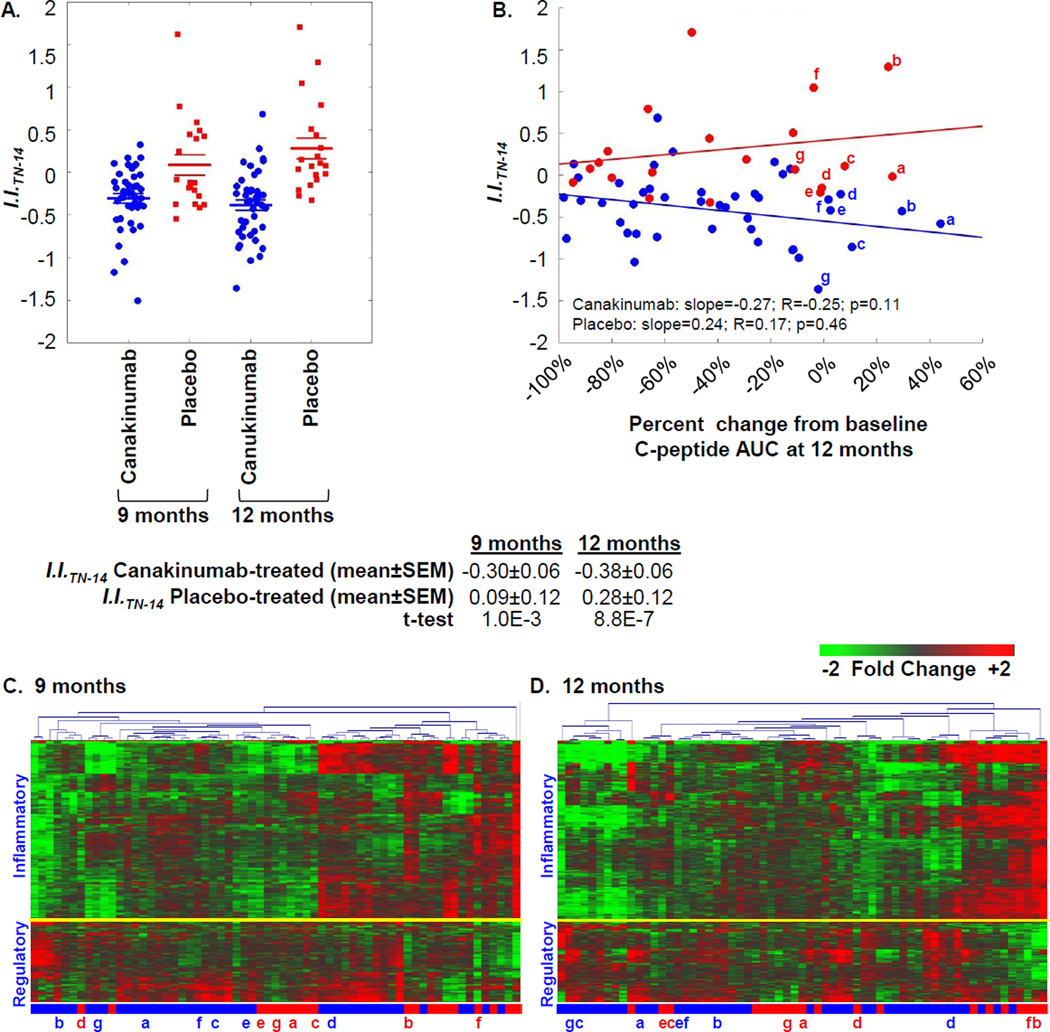
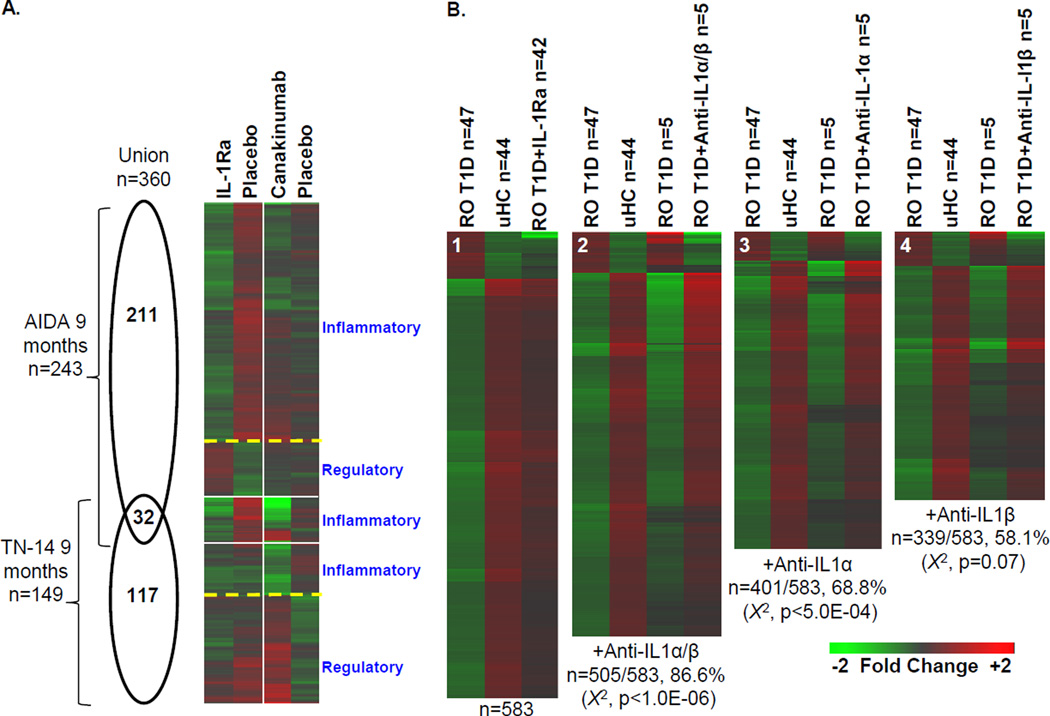
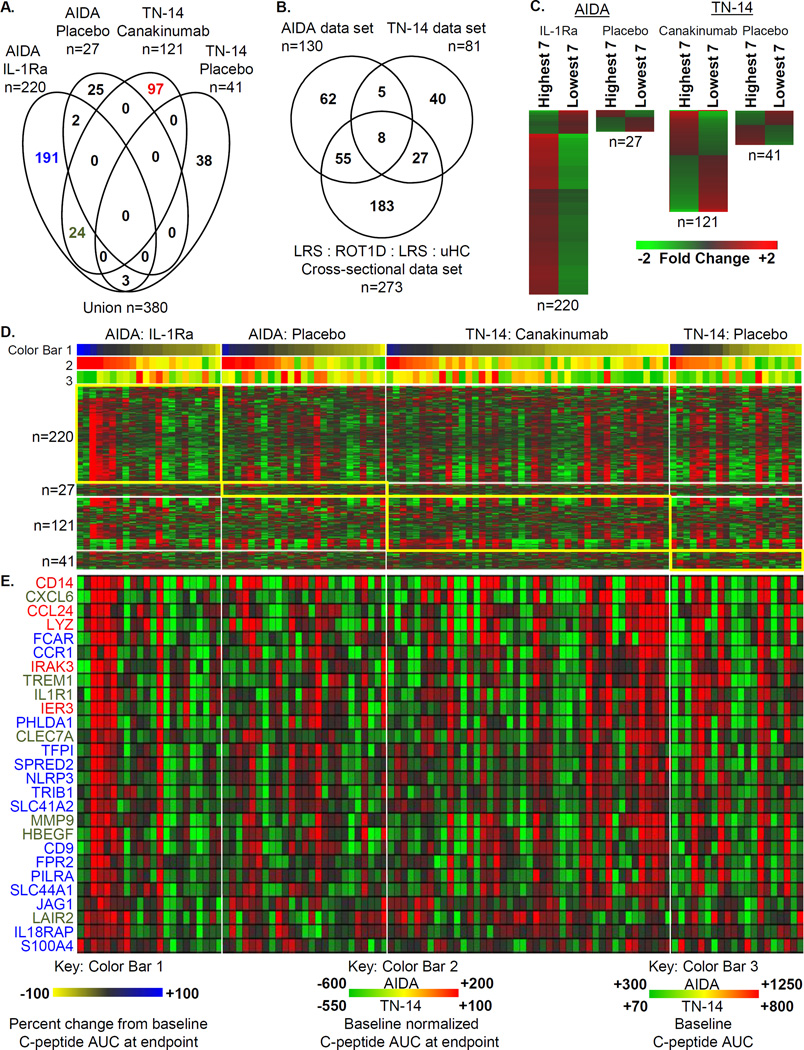
It was hypothesized that IL-1 antagonism would preserve β-cell function in new onset Type 1 diabetes (T1D). However, the Anti-Interleukin-1 in Diabetes Action (AIDA) and TrialNet Canakinumab (TN-14) trials failed to show efficacy of IL-1 receptor antagonist (IL-1Ra) or canakinumab, as measured by stimulated C-peptide response. Additional measures are needed to define immune state changes associated with therapeutic responses. Here, we studied these trial participants with plasma-induced transcriptional analysis. In blinded analyses, 70.2% of AIDA and 68.9% of TN-14 participants were correctly called to their treatment arm. While the transcriptional signatures from the two trials were distinct, both therapies achieved varying immunomodulation consistent with IL-1 inhibition. On average, IL-1 antagonism resulted in modest normalization relative to healthy controls. At endpoint, signatures were quantified using a gene ontology-based inflammatory index, and an inverse relationship was observed between measured inflammation and stimulated C-peptide response in IL-1Ra- and canakinumab-treated patients. Cytokine neutralization studies showed that IL-1α and IL-1β additively contribute to the T1D inflammatory state. Finally, analyses of baseline signatures were indicative of later therapeutic response. Despite the absence of clinical efficacy by IL-1 antagonist therapy, transcriptional analysis detected immunomodulation and may yield new insight when applied to other clinical trials.

Keywords: Anakinra; Canakinumab; Interleukin-1; Transcriptional signatures; Type 1 diabetes.


Conflict of interest statement

Conflict of Interest Disclosure: The authors declare no commercial or financial conflict of interest.

Figures

Figure 1
Figure 1
Plasma-induced signature analysis of AIDA trial participants. Among the 69 AIDA subjects, our analyses included 22 IL-1Ra treated subjects (age 26.0±2.9 years; range 18.1 – 33.6) and 25 placebo-treated subjects (age 25.7±2.0 years; range 19.8 – 34.1). These subjects were those with available sample at 0, 1, 3, 6, and 9 months and did not significantly differ from the total cohort. (A) Analysis strategy for identifying transcripts regulated to thresholds between the two treatment arms at 1, 3, 6, and 9 months. The selected thresholds (|log2 ratio| >0.263, 1.2-fold; ANOVA p<0.05) are based upon previous analyses [22, 23]. (B) Venn diagram illustrating the relationship of the union of 827 probe sets regulated to thresholds at 1, 3, 6, and 9 months between the IL-1Ra and placebo arms. Indicated are the number (and percentage) of probe sets that exhibited an FDR ≤30% as well as number (and percentage) of probe sets previously identified when cross-sectionally comparing ROT1D, related and unrelated healthy controls [23]. (C–F) Two-way hierarchical clustering (probe sets and subjects) for the regulated probe sets respectively identified between IL-1Ra-treated (blue bar) and placebo-treated (red bar) subjects at (C) 1 month (n=554 probe sets), (D) 3 months (n=341 probe sets), (E) 6 months (n=175 probe sets), and (F) 9 months (n=243 probe sets). (G) Two-way hierarchical clustering (probe sets and subjects) for the intersection of 75 commonly regulated probe sets regulated between IL-1Ra and placebo subjects at 1, 3, 6, and 9 months with tabulation of the mean fold of change, p-value, and FDR at the 1 month time point. All expression levels are baseline normalized.
Figure 2
Figure 2
Analysis of the union of 827 probe sets regulated between IL-1Ra and placebo treated patients at ≥1 time point. (A) One way clustering (probe sets only) and mean expression levels of probe sets regulated to thresholds: |log2 ratio| >0.263, 1.2-fold; ANOVA p<0.05 at the 1, 3, 6, and 9 month time points (right). The mean IL-1Ra plasma protein levels, as measured in [20], for the two study arms at each time point are indicated. The mean induced expression levels of the 827 probe sets by plasma of the 9 AIDA placebo-treated subjects used in the IL-1Ra add-back experiment are also shown (left). These samples were reanalyzed under 3 conditions: 1) 1 month samples + 0 ng/ml IL-1Ra; 2) 1 month samples + 500ng/ml IL-1Ra (~1× mean levels measured in the treated arm); and 3) 1 month samples + 1000 ng/ml IL-1Ra (~2× mean levels measured in the treated arm). Expression levels illustrated in heat maps are baseline normalized and the two panels are independently centered in terms of scale. (B) Probe sets down-regulated (n=539) and up-regulated (n=288) by plasma of the IL-1Ra arm were independently evaluated by DAVID to identify regulated GO terms. (C) Pearson Correlation Coefficients between 358 probe sets commonly identified through plasma induced signature analysis of AIDA participants and the previously described [23] cross-sectional analyses of ROT1D (n=47) and uHC (n=44) patients. Indicated in parentheses are, respectively, the lower and upper 0.99 confidence intervals (CI). (D) Two-way hierarchical clustering (probe sets and subjects) of IL-1Ra and placebo subjects using mean expression of 358/827 probe sets commonly identified through plasma induced signature analysis of AIDA trial participants at 1, 3, 6, and 9 months and the previously described [23] cross-sectional analyses of LRS (n=42), ROT1D, HRS (n=30) and uHC. IL-1Ra treated subjects are indicated by blue bar, placebo-treated subjects are indicated by red bar (right). The mean expression levels of these probe sets within the cross-sectional cohorts are also shown (left). (E) Mean expression levels of a subset of well annotated transcripts identified among 827 probe sets regulated between the two arms of the AIDA trial at 1, 3, 6, and 9 months. Black font indicates transcript annotated as being “inflammatory”; blue font indicates transcript annotated as being “regulatory”. The mean fold of change of IL-1Ra to placebo is tabulated for each probe set, expression differences that exhibited an FDR ≤30% at 1, 3, 6, or 9 months are indicated by a, b, c, or d, respectively. As indicated by the white overlaid arrows, an overall increasing IL10/TGFβ bias and decreasing IL-1 bias was identified across the LRS→ROT1D→HRS→uHC continuum.
Figure 3
Figure 3
Ontology-based scoring of AIDA participant plasma induced transcriptional signatures. (A) Mean Inflammatory Index (I.I.AIDA) of participants in the IL-1Ra (blue) and placebo (red) arms at 1, 3, 6, and 9 months. The mean I.I.AIDA was significantly different between the two arms at each time point. (B) Relationship between percentage change from baseline to 9 month C-peptide AUC and scored signatures using I.I.AIDA at 9 months. The plot is similar if data are considered as C-peptide AUC from the 9 month visit normalized by baseline: IL-1Ra: slope= −1.39; R=−0.55; p=0.009; Placebo: slope=−0.03; R=−0.13; p=0.52. The tertile of IL-1Ra and placebo –treated subjects that showed the highest percentage of baseline C-peptide at 9 months are indicated in lower case letters, these individuals are indicated in panels (C–F). (C–F) Two-way hierarchical clustering (probe sets and subjects) for 827 regulated probe sets respectively identified between IL-1Ra-treated and placebo-treated subjects at (C) 1 month, (D) 3 months, (E) 6 months, and (F) 9 months. As indicated, a yellow line separate transcripts generally annotated as being inflammatory or regulatory. A subset of IL-1Ra treated patients with intermediary residual β-cell function at baseline showed an increase in C-peptide relative to placebo (indicated with arrows).
Figure 4
Figure 4
Plasma induced signature analysis of TN-14 trial participants. Among the 69 TN-14 study participants, our analyses included samples of 43 canakinumab-treated subjects (age 12.3 ± 4.0 years; range 6.5 – 25.6 years) and 20 placebo-treated subjects (age 12.2 ± 6.0 years; range 6.1 – 32.0 years). These subjects represented those with available sample at 0, 9 and 12 months, and did not significantly differ from the total cohort. Data collected at 9 and 12 month time points was baseline normalized. After unblinding, differentially induced transcripts (|log2 ratio| >0.263, 1.2-fold; ANOVA p<0.05) between the treatment arms were identified. (A) Venn diagram illustrating the relationship of the union of 602 probe sets regulated to thresholds at 9 and 12 months between the canakinumab and placebo arms. Indicated are the number (and percentage) of probe sets that exhibited an FDR ≤30% as well as number (and percentage) of probe sets previously identified when cross-sectionally comparing ROT1D, related and unrelated healthy controls [23]. (B and C) Two-way hierarchical clustering (probe sets and subjects) for the regulated probe sets respectively identified between canakinumab (denoted by blue bar) and placebo (denoted by red bar) subjects at (B) 9 months (n=149 probe sets) and (C) 12 months (n=542 probe sets). All expression levels are baseline normalized.
Figure 5
Figure 5
Pathway analysis of the union of 602 probe sets regulated between canakinumab- and placebo-treated patients. (A) One way clustering (probe sets only) and mean expression levels of probe sets regulated to thresholds (|log2 ratio| >0.263, 1.2-fold; ANOVA p<0.05) at the 9 and 12 month time points. (B) Probe sets down-regulated (n=418) and up-regulated (n=184) by plasma of the canakinumab arm were independently evaluated for biological pathway enrichment using DAVID to identify regulated GO terms. Representative pathway terms, the number of identified genes and significance of enrichment are tabulated. (C) Pearson Correlation Coefficients between the 238 probe sets commonly identified through plasma induced signature analysis of TN-14 trial participants and cross-sectional analyses of ROT1D patients and uHC. Indicated in parentheses are, respectively, the lower and upper 0.99 confidence intervals (CI). (D) Two-way hierarchical clustering (probe sets and subjects) of canakinumab-treated (blue bar) and placebo-treated (red bar) subjects using the 238 probe sets commonly identified through plasma induced signature analysis of TN-14 trial participants and cross-sectional analyses of LRS (n=42), ROT1D (n=47), HRS (n=30) and uHC (n=44) (right). The mean expression levels of these probe sets within the cross-sectional cohorts are shown (left). (E) Mean expression levels of a subset of well annotated transcripts identified among 602 probe sets regulated between the arms of the TN-14 trial. Black font indicates transcript annotated as being “inflammatory”; blue font indicates transcript annotated as being “regulatory”. The mean fold of change of IL-1Ra to placebo is tabulated for each probe set, expression differences that exhibited an FDR ≤30% at 9 or 12 months are indicated by a, or b, respectively. As indicated by the white overlaid arrows, an overall increasing IL10/TGFβ bias and decreasing IL-1 bias was identified across the LRS→ROT1D→HRS→uHC continuum. All expression levels are baseline normalized.
Figure 6
Figure 6
Ontology-based scoring of TN-14 participant signatures. (A) Mean Inflammatory Index (I.I.TN-14) of participants in the canakinumab (blue) and placebo (red) arms at 9 and 12 months. As tabulated, the mean I.I.TN-14 was significantly different between the two arms at each time point. (B) Relationship between percentage change in C-peptide AUC from baseline to 12 months for each subject and scored signatures using I.I.TN-14 at 12 months. The plot is similar and the relationship is not significant if data are considered as C-peptide AUC from the 12 month visit normalized by baseline: Canakinumab: slope= −0.21; R=−0.07; p=0.66; Placebo: slope=0.55; R=0.16; p=0.49. The tertile of canakinumab and placebo-treated subjects showing the highest percentage of baseline C-peptide at 12 months are indicated in lower case letters, these individuals are indicated in panels (C–D). (C–D) Two-way hierarchical clustering (probe sets and subjects) for the 602 regulated probe sets respectively identified between canakinumab and placebo subjects at (C) 9 months and (D) 12 months. As indicated, a yellow line separate transcripts generally annotated as being inflammatory or regulatory.
Figure 7
Figure 7
The distinctiveness of plasma induced signatures of AIDA and TN-14 participants at 9 months. (A) Venn diagram illustrating the relationship of the union of 360 probe sets regulated to thresholds (|log2 ratio| >0.263, 1.2-fold; ANOVA p<0.05) between treatment and placebo-treated arms of the AIDA and TN-14 trials at 9 months (left). One way clustering (probe sets only) and mean expression levels of probe sets regulated to thresholds at 9 months. For each data set and intersection, an indication of the general function of the cluster is indicated based on ontological analyses (right). (B) Additive effects of IL-1α and IL-1β on the ROT1D signature. Previously [23], adding 4 µg/mL IL-1Ra to ROT1D cultures (n = 47) modulated IL-1–dependent components of the ROT1D:uHC signature, directionally altering expression of 583/762 genes (76.5%; χ2 p < 10E-6; panel B1). Here, 5 pediatric ROT1D subjects with mean plasma IL-1α levels of 89.4 +/− 56.4 pg/ml and IL-1β levels of 4.6 +/− 5.0 pg/ml were studied. Addition of both IL-1α –neutralizing antibodies (15 µg/mL) and IL-1β –neutralizing antibodies (0.3 µg/mL) to the 5 ROT1D cultures directionally altered 505/583 of the previously identified IL-1Ra dependent transcripts (86.6%; χ2 p < 1.0E-6; panel B2). Addition of IL-1α–neutralizing antibodies (15 µg/mL) to the 5 ROT1D cultures directionally altered 401/583 of the previously identified IL-1Ra-dependent transcripts (68.8%; χ2 p < 5.0E-4; panel B3). Addition of IL-1β–neutralizing antibodies (0.3 µg/mL) to the 5 ROT1D cultures directionally altered 339/583 of the previously identified IL-1Ra dependent transcripts (58.1%; χ2 p=0.07; panel B4). Nonspecific isotypic control antibodies did not significantly modulate expression. Regulated transcripts are provided in Supporting Information Table 2.
Figure 8
Figure 8
The relationship between the plasma induced signature at the baseline sampling and the percentage change in C-peptide AUC from baseline to study endpoint (9 months for AIDA and 12 months for TN-14). (A) Venn diagram illustrating the relationship of the union of 380 probe sets regulated to thresholds (|log2 ratio| >0.263, 1.2-fold; ANOVA p<0.05) when comparing the tertile (n=7) of subjects possessing the highest and the lowest percent change from baseline C-peptide AUC at study endpoint within each of the 4 study arms. (B) Venn diagram showing the distribution of the 380 regulated probe sets among the 3 source data sets: AIDA (n=827 total probe sets), TN-14 (n=602 total probe sets) and the uHC/LRS/HRS/ROT1D cross-sectional (n=2,422 total probe sets). (C) Mean expression levels of regulated probe sets identified when comparing, within each arm, 7 subjects with the highest and lowest percent change from baseline C-peptide AUC at study endpoint. (D) One-way hierarchical clustering (probe sets) of the 4 data sets illustrated in (A). As reflected by Color Bar 1, subjects within each study arm (D and E) are sorted by percent change from baseline C-peptide AUC at study endpoint (highest to lowest, blue to yellow). Color Bar 2 provides a measure of baseline normalized C-peptide AUC (highest to lowest, red to yellow to green) and shows the general rank order is conserved. Color Bar 3 provides a measure of the baseline C-peptide AUC. (E) Mean expression levels of a subset of well annotated transcripts identified within the IL-1Ra and canakinumab treatment arms. The font colors used for gene symbols are coded to the Venn diagram in (A). Conducting the analysis by comparing subjects with the highest and lowest baseline normalized C-peptide AUC yielded similar results and did not alter the overall biological interpretation.

References

    1. Mandrup-Poulsen T, Pickersgill L, Donath MY. Blockade of interleukin 1 in type 1 diabetes mellitus. Nat Rev Endocrinol. 2010;6:158–166. - PubMed
    1. Todd JA. Etiology of type 1 diabetes. Immunity. 2010;32:457–467. - PubMed
    1. Stiller CR, Dupre J, Gent M, Jenner MR, Keown PA, Laupacis A, Martell R, Rodger NW, von Graffenried B, Wolfe BM. Effects of cyclosporine immunosuppression in insulin-dependent diabetes mellitus of recent onset. Science. 1984;223:1362–1367. - PubMed
    1. Keymeulen B, Vandemeulebroucke E, Ziegler AG, Mathieu C, Kaufman L, Hale G, Gorus F, Goldman M, Walter M, Candon S, Schandene L, Crenier L, De Block C, Seigneurin JM, De Pauw P, Pierard D, Weets I, Rebello P, Bird P, Berrie E, Frewin M, Waldmann H, Bach JF, Pipeleers D, Chatenoud L. Insulin needs after CD3-antibody therapy in new-onset type 1 diabetes. N Engl J Med. 2005;352:2598–2608. - PubMed
    1. Pescovitz MD, Greenbaum CJ, Krause-Steinrauf H, Becker DJ, Gitelman SE, Goland R, Gottlieb PA, Marks JB, McGee PF, Moran AM, Raskin P, Rodriguez H, Schatz DA, Wherrett D, Wilson DM, Lachin JM, Skyler JS. Rituximab, B-lymphocyte depletion, and preservation of beta-cell function. N Engl J Med. 2009;361:2143–2152. - PMC - PubMed

Publication types

MeSH terms

Grants and funding