. 2015 Dec 18:8:42.
doi: 10.1186/s13040-015-0076-y. eCollection 2015.

A significant risk locus on 19q13 for bipolar disorder identified using a combined genome-wide linkage and copy number variation analysis

Affiliations

A significant risk locus on 19q13 for bipolar disorder identified using a combined genome-wide linkage and copy number variation analysis

Magnus Lekman et al. BioData Min. .

Abstract

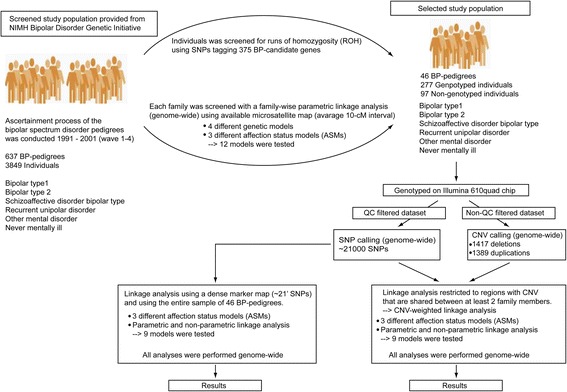
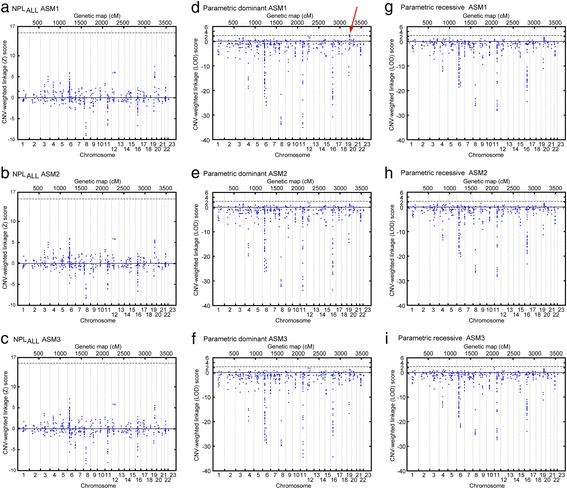
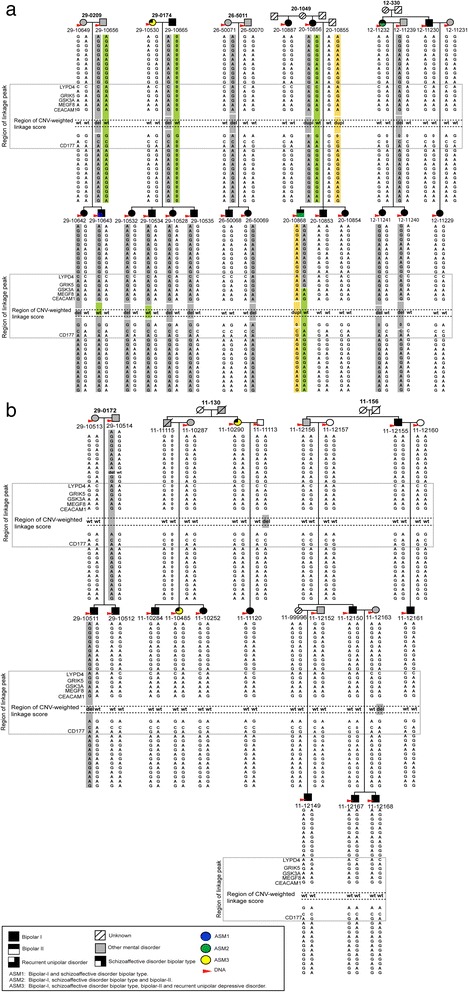
Background: The genetic background to bipolar disorder (BPD) has been attributed to different genetic and genomic risk factors. In the present study we hypothesized that inherited copy number variations (CNVs) contribute to susceptibility of BPD. We screened 637 BP-pedigrees from the NIMH Genetic Initiative and gave priority to 46 pedigrees. In this subsample we performed parametric and non-parametric genome-wide linkage analyses using ~21,000 SNP-markers. We developed an algorithm to test for linkage restricted to regions with CNVs that are shared within and across families.

Results: For the combined CNV and linkage analysis, one region on 19q13 survived correction for multiple comparisons and replicates a previous BPD risk locus. The shared CNV map to the pregnancy-specific glycoprotein (PSG) gene, a gene-family not previously implicated in BPD etiology. Two SNPs in the shared CNV are likely transcription factor binding sites and are linked to expression of an F-box binding gene, a key regulator of neuronal pathways suggested to be involved in BPD etiology.

Conclusions: Our CNV-weighted linkage approach identifies a risk locus for BPD on 19q13 and forms a useful tool to future studies to unravel part of the genetic vulnerability to BPD.

Keywords: Bipolar disorder; Copy number variation; Genome-wide; Linkage analysis.


Figures

Fig. 1
Fig. 1
Flow chart of analytic strategy. A brief overview of our incremental strategy for finding inherited CNVs contributing to susceptibility of BPD. The flow chart illustrates our hierarchical two-stage selection procedure to reduce the entire wave 1–4 pedigree sample from NIMH Bipolar Disorder Genetic Initiative, into a smaller sample aiming to reduce heterogeneity and increase power to find segregating CNV with risk to BPD. The two screening methods we applied were a genome-wide family-wise linkage analysis and an analysis for the presence of stretches of deletions in BP-candidate genes. Calculation for linkage was performed under 3 different affection status models (ASMs). ASM 1: bipolar type 1 and schizoaffective disorder bipolar type, ASM 2: bipolar type 1 and schizoaffective disorder bipolar type and bipolar type 2, ASM 3: bipolar type 1 and schizoaffective disorder bipolar type and bipolar type 2 and recurrent depressive disorder. These analyses intend to ensure that family members were ascertained for having high genetic liability to BPD. Our selection procedure implies that a subsample of families and family members were selected out of the entire wave1–4 samples. The main features in marker calling for SNPs (using polymorphic markers) and CNVs (monomorphic markers) are shown. The flow chart illustrates the two different analyses that were used to test for inherited CNVs (i) a linkage analysis and (ii) a CNV-weighted linkage analysis which is based on our algorithm that sum the family-wise linkage scores in regions with CNVs that are shared within and across families. We addressed the issue with clinical and genetic heterogeneity for risk to BPD by categorizing individuals into 3 different ASMs and tested for parametric linkage under dominant and recessive models, and for non-parametric (HLOD) linkage
Fig. 2
Fig. 2
Results of the genome-wide CNV-weighted linkage analyses. The plots illustrate genome-wide CNV-weighted linkage scores of the parametric (dominant and recessive) and non-parametric (NPLALL statistics) models under the three affection status models (ASM1-3). The sum of average family-wise linkage scores LOD scores for parametric and Z scores for non-parametric models were calculated over regions with the presence of copy number variation that is shared between at least two individuals within and across families. The thresholds for significance (dotted lines) were defined after a 1000-fold simulation analysis including FWER correction
Fig. 3
Fig. 3
CNV-weighted linkage analysis at 19q13. Linkage scores and CNV-weighted linkage scores are illustrated relative to UCSC genes and structural variations in Data Base of Genomic Variation (DGV). The plotted red linkage curve represents results of the LOD scores from 5 pedigrees (pedigree-id: 29–0209, 29–0174, 26–5011, 20–1049 and 12–330), consisting of 12 individuals (ind-id: 29–10642, 29–10656, 29–10528, 29–10535, 29–10532, 26–50071, 26–50069, 20–10868, 20–10856, 12–11239, 12–11241 and 12–11240) who shared a CNV and which generated CNV-weighted linkage scores (chr19:48066441–48114839 and chr19:48114839–48157656) that survived correction for multiple comparisons (empirical P = 0.033). The green vertical line marks the location of the shared CNV from these 5 families relative to the linkage peak and relative to the UCSC genes. Lower panel displays reported structural variations from DGV. Color scheme of DGV CNVs; blue: gain, red: loss, purple: inversion, black: unknown, and brown: both loss and gain. All genomic coordinates are according to NCBI36/hg18
Fig. 4
Fig. 4
Haplotype analysis of families with CNVs in 19q13. Phasing analysis of genotypes to generate the most likely haplotype in pedigrees with CNVs on chromosome 19q13, was carried out with the GENEHUNTER software. Forty-seven markers representing all available markers in this region, spanning a region of 17.04 Mb, were included for the haplotype analysis. To simplify illustration of results, flanking markers were removed and only genotypes for 33 markers most proximal to the CNV are depicted, mapping a 6.05 Mb region. The linkage peak region is marked with a gray window and spans 1.5 Mb. The region with the two adjacent significant CNV-weighted linkage scores (91,215 bp in size) is illustrated with a gray dashed line. CNVs of duplication are denoted ‘dupl’, deletions are denoted ‘del’ and the normal state (wild type) are denoted ‘wt’. Haplotypes are displayed in colors (only for relevant chromosomes) to illustrate inheritance of gain/loss of genomic segments. The relative genomic region of each CNV is illustrated by separate colored segments. Of note, CNV calling was made based on a complete set of non-QC filtered sample of both monomorphic and polymorphic probes whereas analysis of the haplotypes was made using QC filtered polymorphic probes only. In order to retrieve recombinant mapping of high resolution, all available SNP-markers located within the linkage peak region were included. Representative gene-id’s are displayed. All genomic coordinates are according to NCBI36/hg18. a Results of the initial analysis of CNV-weighted linkage scores with 5 pedigrees consisting of 12 individuals with a shared CNV. In pedigree 29–0174 no DNA was available for individual 29–10665 who was therefore excluded from the initial CNV-weighted analysis. The CNV status for this individual was revealed in the subsequent phased haplotype analysis. Moreover, in pedigree 20–1049 the CNV-carriership in 20–10855 was detected using the subsequent phased haplotype analysis. b Results of the extended analysis to find undetected CNV’s. In our first attempt to identify undetected CNV’s in this region we manually checked the CNV calling and identified 3 individuals with deletions, 11–11113, 11–112163 and 29–10511, and individual 29–10514 with a deletion in the adjacent region. Finally, a phased haplotype analysis indicates that the CNV in 29–10511 is a de novo event and that no transmission of CNV’s occurs in the pedigrees 11–130 and 11–156. This analysis further indicates deletions in 29–10665 and 20–10855

Similar articles

References

    1. Hirschfeld RM, Vornik LA. Bipolar disorder--costs and comorbidity. Am J Manag Care. 2005;11:S85–90. - PubMed
    1. Merikangas KR, Jin R, He JP, Kessler RC, Lee S, Sampson NA, et al. Prevalence and correlates of bipolar spectrum disorder in the world mental health survey initiative. Arch Gen Psychiatry. 2011;68:241–251. doi: 10.1001/archgenpsychiatry.2011.12. - DOI - PMC - PubMed
    1. Marneros A, Angst J. Bipolar Disorders, 100 years after manic-depressive insanity. New York: Kluwer Academic Publishers; 2002.
    1. Smoller JW, Finn CT. Family, twin, and adoption studies of bipolar disorder. Am J Med Genet C Semin Med Genet. 2003;123C:48–58. doi: 10.1002/ajmg.c.20013. - DOI - PubMed
    1. Schulze TG, Akula N, Breuer R, Steele J, Nalls MA, Singleton AB, et al. Molecular genetic overlap in bipolar disorder, schizophrenia, and major depressive disorder. World J Biol Psychiatry. 2012;15:200–208. doi: 10.3109/15622975.2012.662282. - DOI - PMC - PubMed

LinkOut - more resources