. 2015 Dec 12:8:54.
doi: 10.1186/s13072-015-0047-z. eCollection 2015.

Genetic and epigenetic variation among inbred mouse littermates: identification of inter-individual differentially methylated regions

Affiliations

Genetic and epigenetic variation among inbred mouse littermates: identification of inter-individual differentially methylated regions

Harald Oey et al. Epigenetics Chromatin. .

Abstract

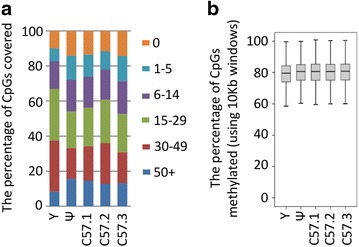
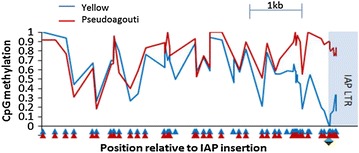
Background: Phenotypic variability among inbred littermates reared in controlled environments remains poorly understood. Metastable epialleles refer to loci that intrinsically behave in this way and a few examples have been described. They display differential methylation in association with differential expression. For example, inbred mice carrying the agouti viable yellow (A (vy) ) allele show a range of coat colours associated with different DNA methylation states at the locus. The availability of next-generation sequencing, in particular whole genome sequencing of bisulphite converted DNA, allows us, for the first time, to search for metastable epialleles at base pair resolution.

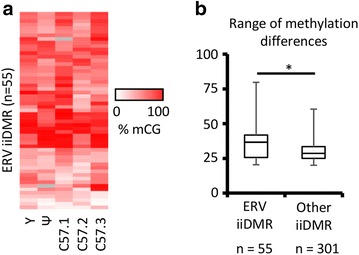
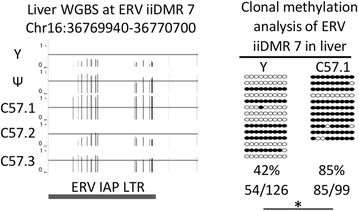
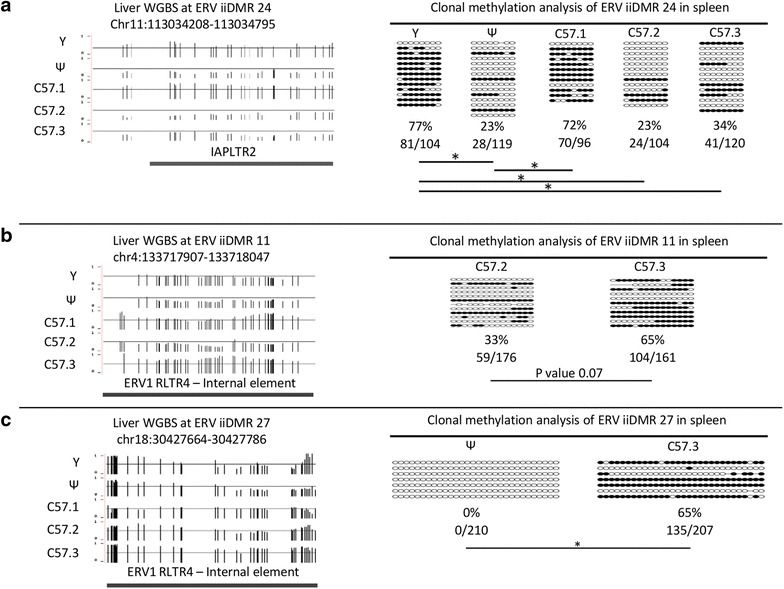
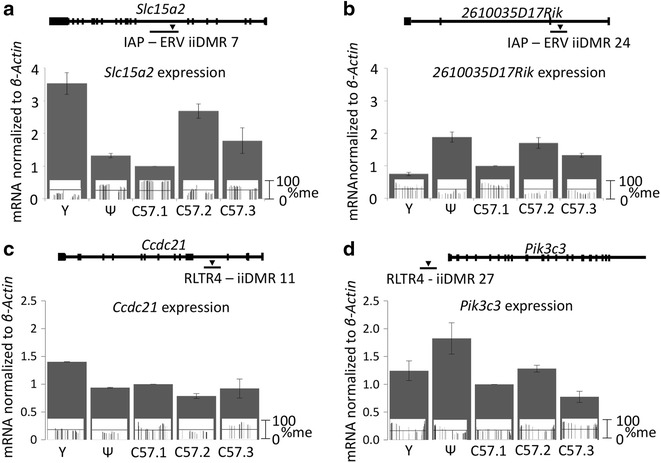
Results: Using whole genome bisulphite sequencing of DNA from the livers of five mice from the A (vy) colony, we searched for sites at which DNA methylation differed among the mice. A small number of loci, 356, were detected and we call these inter-individual Differentially Methylated Regions, iiDMRs, 55 of which overlap with endogenous retroviral elements (ERVs). Whole genome resequencing of two mice from the colony identified very few differences and these did not occur at or near the iiDMRs. Further work suggested that the majority of ERV iiDMRs are metastable epialleles; the level of methylation was maintained in tissue from other germ layers and the level of mRNA from the neighbouring gene inversely correlated with methylation state. Most iiDMRs that were not overlapping ERV insertions occurred at tissue-specific DMRs and it cannot be ruled out that these are driven by changes in the ratio of cell types in the tissues analysed.

Conclusions: Using the most thorough genome-wide profiling technologies for differentially methylated regions, we find very few intrinsically epigenetically variable regions that we term iiDMRs. The most robust of these are at retroviral elements and appear to be metastable epialleles. The non-ERV iiDMRs cannot be described as metastable epialleles at this stage but provide a novel class of variably methylated elements for further study.

Keywords: DNA methylation; Genetic variation; Inbred mice; Metastable epiallele.


Figures

Fig. 1
Fig. 1
WGBS methylation of the five individuals. a The coloured bars indicate read depth and the Y-axis shows the percent of global CpGs in each category. b Box and whisker plot showing the percentage of all CpGs that are methylated for each of the five individuals, using 10 kb windows across the genome
Fig. 2
Fig. 2
DNA methylation at A vy. The weighted average DNA methylation levels of single CpG dinucleotides in the yellow mouse (blue) and the pseudoagouti mouse (red) show changes extending out from the IAP insertion, which is upstream of the agouti gene. Data are shown only when more than five reads cover a CpG. Ectopic agouti transcripts originate from the LTR element (green)
Fig. 3
Fig. 3
Variable DNA methylation at ERVs. a Heatmap representing the 55 iiDMRs overlapping ERV elements. For these sites, the weighted average CpG methylation for each mouse is shown. Unsupervised clustering was performed. Data for the yellow mouse are shown but were not used to identify the differentially methylated sites. b The range of methylation at each ERV iiDMR (n = 55) for the five mice is shown and compared with that of all 301 iiDMRs generated from Additional file 1: Table S3 after removal of the ERV-associated loci. ERV iiDMRs have a significantly greater range (T test, p value <0.05)
Fig. 4
Fig. 4
Methylation variability at ERV iiDMR 7 validated using an independent method. A screenshot of the WGBS methylation at ERV iiDMR 7 is shown for the five mice (left). On the Y-axis 0 represents no methylation, 1 represents 100 % methylation and the solid lines indicate the 50 % methylation position. The coordinates of the ERV iiDMR 7 overlaps an IAP LTR, indicated in dark grey. Methylation levels from clonal bisulphite sequencing (primer sequences are in Additional file 1: Table S5) on the two extreme samples (yellow and C57.1 mouse DNA) confirmed the differential methylation (right). Each sample is represented by at least 11 clones, filled in circles represent methylated CpGs from each sequenced clone. Asterisk indicates T test, p value <0.05
Fig. 5
Fig. 5
Methylation state at ERV iiDMRs in liver is conserved in spleen. Shown is a UCSC genome browser screen shot of three variably methylated loci, iiDMR 24 (a), iiDMR 11 (b) and iiDMR 27 (c), on the Y-axis 0 represents no methylation, 1 represents 100 % methylation and the solid lines indicate the 50 % methylation position. Shown also are the underlying repeat elements. Clonal bisulphite sequencing (primer sequences are in Additional file 1: Table S5) from spleen revealed the same pattern of differential methylation across the five mice for ERV iiDMR 24 and for the two most extremes of methylation for ERV iiDMR 11 and ERV iiDMR 27. Each sample is represented by at least seven clones, filled in circles represent methylated CpGs. Asterisk indicates T test, p value <0.05
Fig. 6
Fig. 6
Expression of loci adjacent to ERV iiDMRs. The average expression from four technical replicates is shown for two genes, Slc15a2 (a) and 2610035D17Rik (b), in which ERV iiDMR 7 and ERV iiDMR 24, respectively, are located. The location of each IAP is indicated relative to the exonic and intronic sequences of genes, indicated by bars connected by lines. Also shown embedded in each expression bar is the liver methylation level of the iiDMR taken from Figs. 4 and 5. The average expression from two technical replicates is shown for two genes, Ccdc21 (c) and Pik3c3 (d), associated with ERV iiDMR 11 and ERV iiDMR 27, respectively. The ERV iiDMR 11 RLTR4 is located in intron 3 of Ccdc21 while the ERV iiDMR 27 RLTR4 is located approximately 5 kb upstream of the Pik3c3 transcription start site. Error bars indicate the SEM for each technical replicate

References

    1. Gärtner K. A third component causing random variability beside environment and genotype. A reason for the limited success of a 30 year long effort to standardize laboratory animals? Lab Anim. 1990;24(1):71–77. doi: 10.1258/002367790780890347. - DOI - PubMed
    1. Wong AHC, Gottesman II, Petronis A. Phenotypic differences in genetically identical organisms: the epigenetic perspective. Hum Mol Genet. 2005;14(1):R11–R18. doi: 10.1093/hmg/ddi116. - DOI - PubMed
    1. Kaminsky ZA, Tang T, Wang S-C, Ptak C, Oh GHT, Wong AHC, et al. DNA methylation profiles in monozygotic and dizygotic twins. Nat Genet. 2009;41(2):240–245. doi: 10.1038/ng.286. - DOI - PubMed
    1. Fraga MF, Ballestar E, Paz MF, Ropero S, Setien F, Ballestar ML, et al. Epigenetic differences arise during the lifetime of monozygotic twins. Proc Natl Acad Sci USA. 2005;102(30):10604–10609. doi: 10.1073/pnas.0500398102. - DOI - PMC - PubMed
    1. Starling JA, Maule J, Hastie ND, Allshire RC. Extensive telomere repeat arrays in mouse are hypervariable. Nucleic Acids Res. 1990;18(23):6881–6888. doi: 10.1093/nar/18.23.6881. - DOI - PMC - PubMed