. 2015 Nov 1;1(6):678-694.
doi: 10.1016/j.jcmgh.2015.07.006.

Lysosome associated membrane proteins maintain pancreatic acinar cell homeostasis: LAMP-2 deficient mice develop pancreatitis

Affiliations

Lysosome associated membrane proteins maintain pancreatic acinar cell homeostasis: LAMP-2 deficient mice develop pancreatitis

Olga A Mareninova et al. Cell Mol Gastroenterol Hepatol. .

Abstract

Background & aims: The pathogenic mechanism of pancreatitis is poorly understood. Recent evidence implicates defective autophagy in pancreatitis responses; however, the pathways mediating impaired autophagy in pancreas remain largely unknown. Here, we investigate the role of lysosome associated membrane proteins (LAMPs) in pancreatitis.

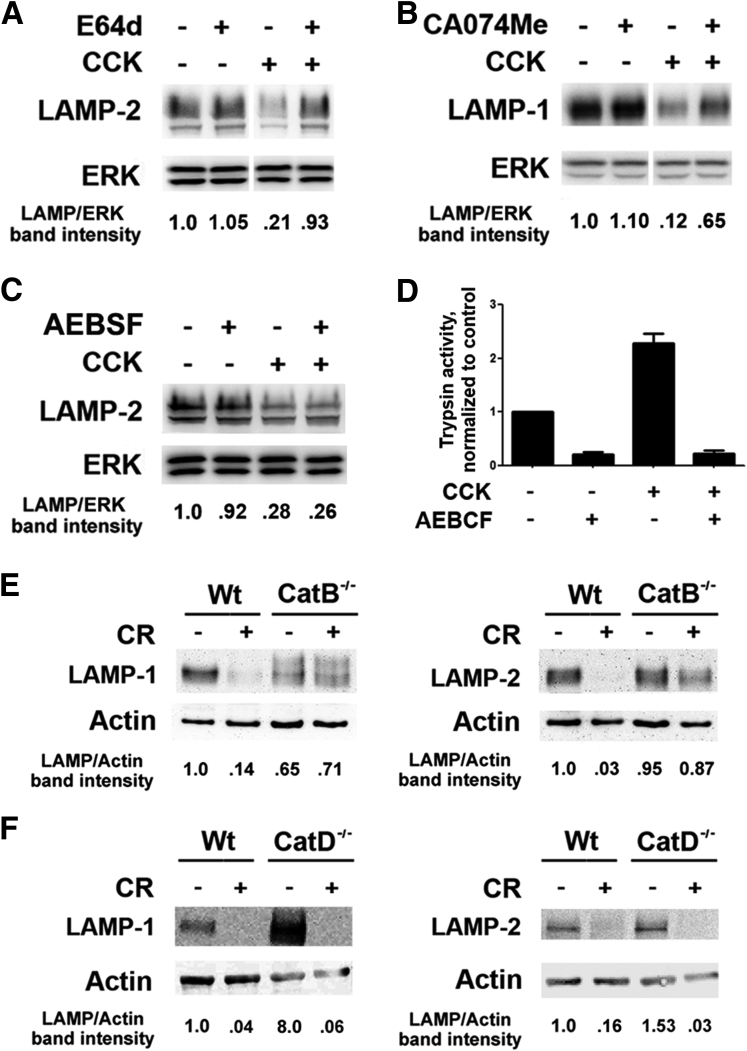
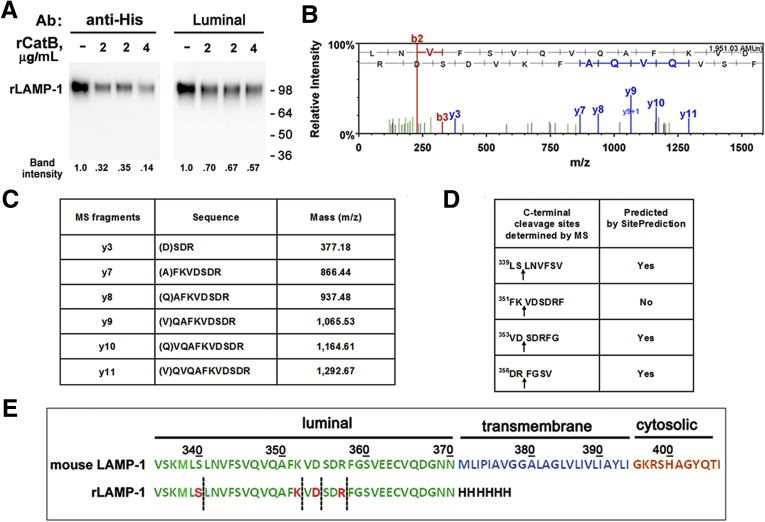
Methods: We analyzed changes in LAMPs in experimental models and human pancreatitis, and the underlying mechanisms: LAMP de-glycosylation and degradation. LAMP cleavage by cathepsin B (CatB) was analyzed by mass spectrometry. We used mice deficient in LAMP-2 to assess its role in pancreatitis.

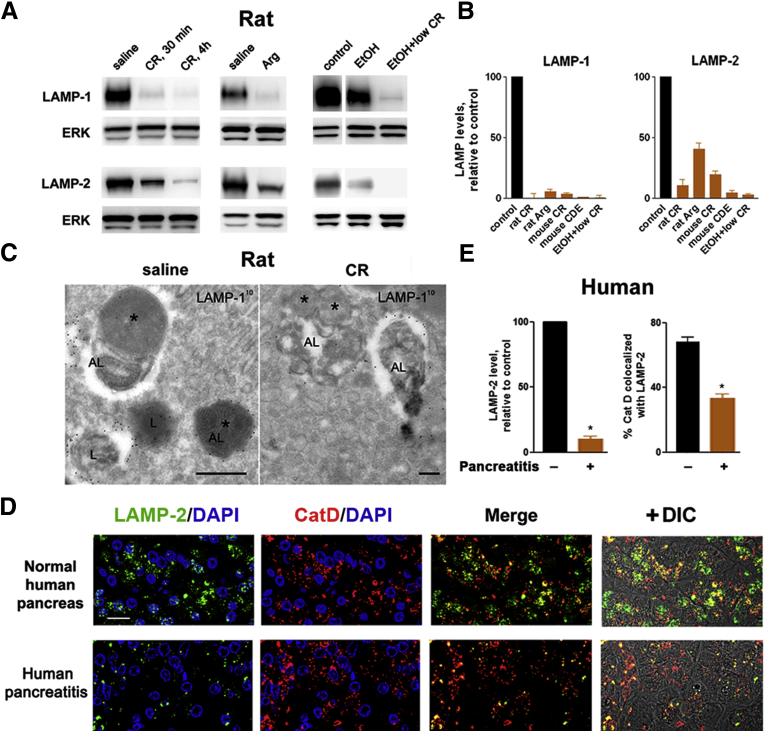
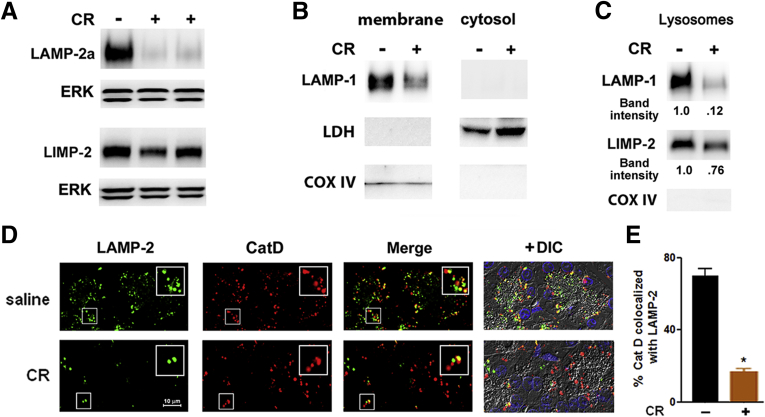
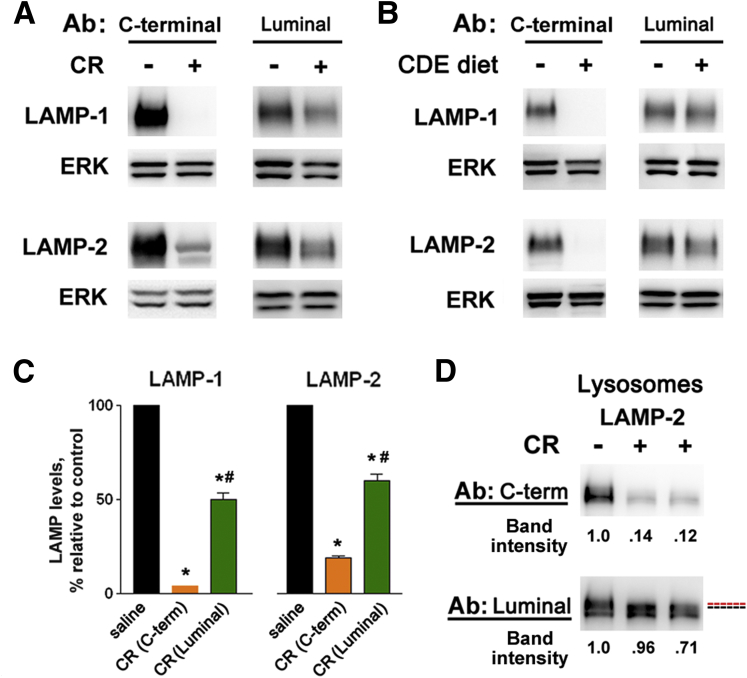
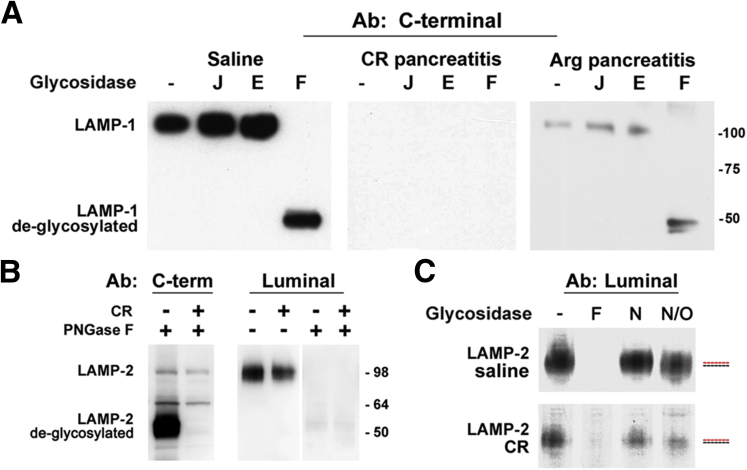
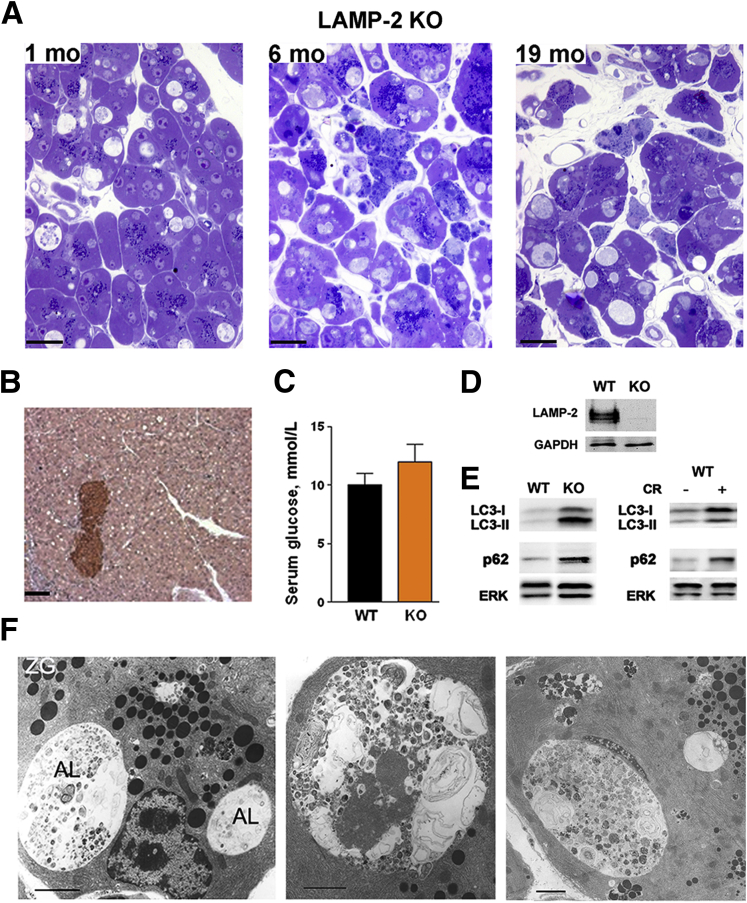
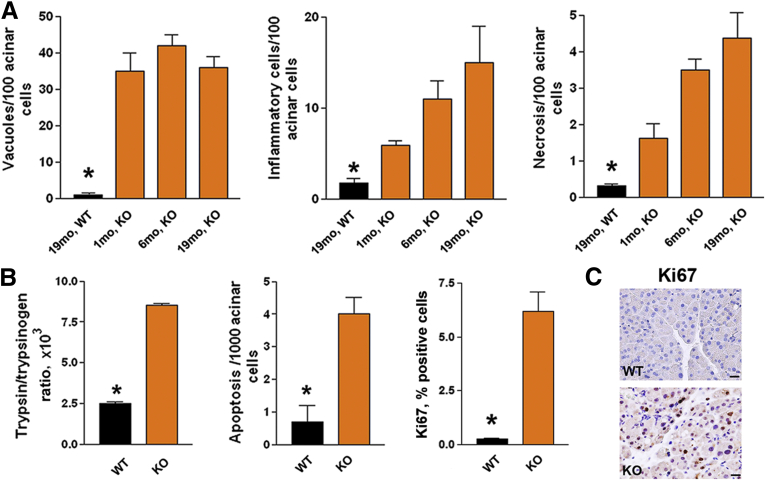
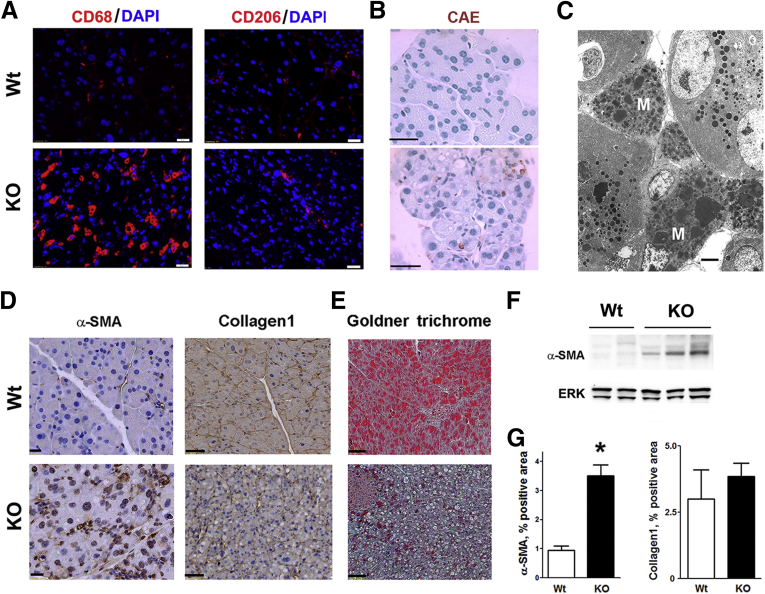
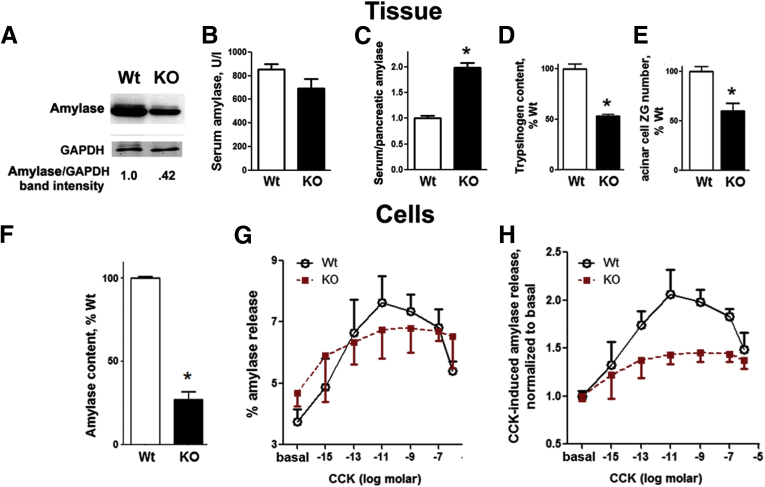
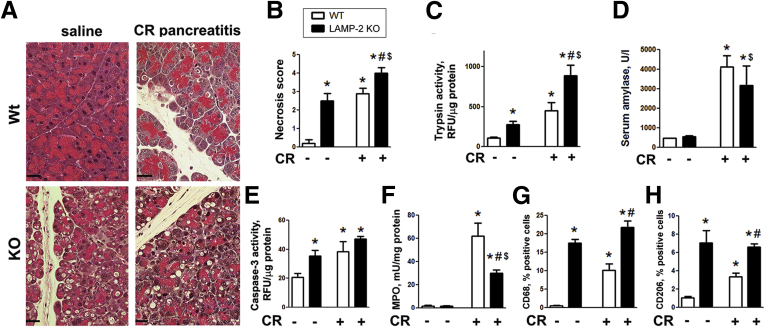
Results: Pancreatic levels of LAMP-1 and LAMP-2 greatly decrease across various pancreatitis models and in human disease. Pancreatitis does not trigger LAMPs' bulk de-glycosylation, but induces their degradation via CatB-mediated cleavage of LAMP molecule close to the boundary between luminal and transmembrane domains. LAMP-2 null mice spontaneously develop pancreatitis that begins with acinar cell vacuolization due to impaired autophagic flux, and progresses to severe pancreas damage characterized by trypsinogen activation, macrophage-driven inflammation, and acinar cell death. LAMP-2 deficiency causes a decrease in pancreatic digestive enzymes content, stimulates the basal and inhibits CCK-induced amylase secretion by acinar cells. The effects of LAMP-2 knockout and acute cerulein pancreatitis overlap, which corroborates the pathogenic role of LAMP decrease in experimental pancreatitis models.

Conclusions: The results indicate a critical role for LAMPs, particularly LAMP-2, in maintaining pancreatic acinar cell homeostasis, and provide evidence that defective lysosomal function, resulting in impaired autophagy, leads to pancreatitis. Mice with LAMP-2 deficiency present a novel genetic model of human pancreatitis caused by lysosomal/autophagic dysfunction.

Keywords: amylase secretion; autophagy; cathepsin B; cerulein.


Conflict of interest statement

: The authors disclose no conflicts

Figures

Figure 1
Figure 1
Pancreatic levels of lysosome-associated membrane protein 1 (LAMP-1) and LAMP-2 decrease in rodent models and human pancreatitis. Pancreatitis was induced in rats by administration of cerulein (CR) or l-arginine (Arg), or by a combination of ethanol diet (EtOH) and low-dose CR; and in mice, by CR or feeding choline-deficient ethionine supplemented (CDE) diet (see Materials and Methods). (A, B). Immunoblot analysis of pancreatic LAMP levels in fully developed pancreatitis and at the onset (after 30 minutes) of CR pancreatitis, using Abs against the C terminus of LAMP-1 (Abcam) and LAMP-2 (Sigma). In this and other figures, extracellular signal-activated kinases 1/2 (ERK1/2), β-actin, or glyceraldehyde-3-phosphate dehydrogenase (GAPDH) are loading controls; each lane represents an individual animal; the data are representative of several immunoblots from at least three animals for each condition; the narrow white space on the immunoblot indicates that the lanes are on the same blot but not contiguous. (B) The densitometric intensity of LAMP band was normalized to that of ERK in the same sample, and the mean LAMP/ERK ratio in pancreatitis group was further normalized to that in control group. Values are mean ± SEM (n = 4 per group). (C). Immunogold electron microscopy labeling shows LAMP-1 in lysosomes (L) and autolysosomes (AL) in pancreas of rats with CR pancreatitis and control (saline). The asterisks point to remnants of sequestered organelles. Scale bar: 500 nm. (D, E). Immunofluorescence analysis of LAMP-2 (using the C-terminal Ab) and cathepsin D (CatD) in human pancreas. Nuclei staining with 4′,6-diamidino-2-phenylindole (DAPI) (blue; not shown in “merge” panels). DIC, differential interference contrast, which prominently displays zymogen granules area in acinar cells. Scale bar: 10 μm (all images). (E) LAMP-2 punctate staining and colocalization of CatD with LAMP-2 in human normal pancreas and pancreatitis were quantified with ImageJ. Values are mean ± SEM from four normal and seven pancreatitis tissue samples from different patients. *P < .05 versus normal pancreas.
Figure 2
Figure 2
Experimental pancreatitis causes a decrease in lysosome-associated membrane proteins (LAMPs), including LAMP-2a, but not in lysosomal integral membrane protein type-2 (LIMP-2). Cerulein (CR) pancreatitis was induced in mice (A–C) and rats (D). Pancreatic levels of indicated proteins were measured by immunoblot, using C-terminal Abs, in (A) whole tissue homogenates, (B) membrane and cytosolic fractions, and (C) lysosome-enriched fraction (see Materials and Methods). Extracellular signal-activated kinases 1/2 (ERK1/2), lactate dehydrogenase, and cyclooxygenase IV (COX IV) served as controls for equal loading and the quality of subcellular fractionation. Data in B and C are representative of two independent experiments, with similar results. (D) Colocalization of LAMP-2 and cathepsin D (CatD) in pancreas of control (saline) rats and rats with CR pancreatitis. Tissue sections were double immunostained for LAMP-2 (using C-terminal Ab) and CatD. Insets show higher magnification for the areas in smaller boxes. Scale bar is the same for all images. DIC, differential interference contrast. (E). CatD colocalization with LAMP-2 was quantified with ImageJ. Values are mean ± SEM (n = 3–4 per group); *P < .05 versus control.
Figure 3
Figure 3
Pancreatitis preferentially affects lysosome-associated membrane protein (LAMP) C terminus. LAMP levels were measured by immunoblot in (A–C) whole-tissue homogenates and (D) lysosome-enriched fraction from pancreata of mice with cerulein (CR) or choline-deficient, ethionine-supplemented diet (CDE) pancreatitis, using either Abs against the C terminus of LAMP-1 (Abcam) and LAMP-2 (Sigma-Aldrich) or Abs that recognize the luminal part of LAMPs (Iowa Developmental Studies Hybridoma Bank; see Materials and Methods). (C) LAMP band intensity was normalized to that of extracellular signal-activated kinases (ERK) in the same sample, and the mean LAMP/ERK ratio in pancreatitis group was further normalized to that in control (saline) group. Values are mean ± SEM (n = 4 per group). *P < .05 versus control; #P < .05 versus the corresponding LAMP band intensity detected with C-terminal Ab. (D) Red and blue dashed lines indicate a shift in the position of LAMP-2 band.
Figure 4
Figure 4
Pancreatitis does not cause bulk lysosome-associated membrane protein (LAMP) deglycosylation. Cerulein (CR) and l-arginine (Arg) pancreatitis were induced in (A) rats or (B, C) mice. Pancreatic tissue homogenates from control (saline) and pancreatitic animals were treated with PNGase F (F), Jack bean α-mannosidase (J), endoglycosidase H (E), neuraminidase (N), or neuraminidase plus O-glycanase (N/O), as described in Materials and Methods. LAMP-1 and LAMP-2 were analyzed by immunoblot using C-terminal or luminal Abs, as indicated. Numbers to the right are protein molecular mass markers in kDa. (C) Red and blue dashed lines indicate a shift in the position of LAMP-2 band.
Figure 5
Figure 5
Lysosome-associated membrane protein (LAMP) degradation in cerulein (CR) pancreatitis is mediated by cathepsin B (CatB). LAMP levels were measured by immunoblot, using C-terminal Ab, in (A–C) freshly prepared pancreatic lobules incubated with or without 100 nM cholecystokinin-8 (CCK-8) in the absence and presence of (A) a broad-spectrum cysteine protease inhibitor E64d (50 μM), (B) CatB inhibitor CA074Me (50 μM), or (C) serine protease inhibitor AEBSF [4-(2-aminoethyl)benzenesulfonyl fluoride] (1 mM); and (E, F) in the pancreas of wild type, CatB−/−, or CatD−/− mice with CR pancreatitis. LAMP band intensity was normalized to that of extracellular signal-activated kinase (ERK) or actin in the same sample. The data are representative of several immunoblots on at least three preparations of lobules or three mice of each genotype. (D). Trypsin activity was measured in mouse acinar cells incubated for 30 minutes with or without 100 nM CCK-8 in the absence and presence of 1 mM AEBSF. Values are mean ± SEM from duplicate measurements in two independent experiments.
Figure 6
Figure 6
Mass spectrometry (MS) analysis of mouse recombinant lysosome-associated membrane protein 1 (LAMP-1) peptides generated by cleavage with cathepsin B (CatB). (A). Recombinant (r) mouse LAMP-1 (rLAMP-1) was incubated for 1 hour at 37°C with the indicated concentrations of active rCatB (see Materials and Methods). The rLAMP-1 level was measured by immunoblot using either the luminal Ab or an Ab against C-terminal 6-His tag; rLAMP-1 band intensity was normalized to that in the absence of rCatB. Numbers to the right are protein molecular mass markers in kDa. Representative of two independent experiments, with similar results. (B, C). Mass spectrometry data for C-terminal fragments of rLAMP-1 generated by incubation with CatB. (D). Comparison of CatB cleavage sites detected by MS versus CatB cleavage sites in mouse LAMP-1 predicted by the SitePrediction web tool (http://www.dmbr.ugent.be/prx/bioit2). (E). C-terminal amino acid sequences of mouse LAMP-1 and rLAMP-1. Dashed lines indicate sites of rLAMP-1 cleavage by CatB detected by MS.
Figure 7
Figure 7
Lysosome-associated membrane protein 2 (LAMP-2) genetic ablation causes impaired autophagy in the exocrine pancreas. (A). Toluidine-blue stained pancreatic tissue sections from LAMP-2 null (knockout) mice showing acinar cell vacuolization, tissue disorganization, and inflammatory cell infiltration. Scale bar: 20 μm. (B) Immunohistochemistry for insulin in pancreas of LAMP-2 knockout mice. Note massive vacuolization of acinar but not islet cells. Scale bar: 50 μm. (C). Serum glucose levels in wild-type and LAMP-2 knockout mice. Values are mean ± SEM (n = 3 per group). (D, E). LAMP-2, microtubule-associated protein-1 light chain 3 (LC3), and p62/SQSTM1 (sequestosome 1) were measured by immunoblot in pancreata of LAMP-2 knockout mice and wild-type mice with CR pancreatitis. (F). Electron micrographs showing abnormally large autolysosomes (AL) containing partially degraded material in pancreas of LAMP-2 knockout mice. ZG, zymogen granules. Scale bar: 2 μm. The data in B–F are for 6-month-old LAMP-2 knockout mice.
Figure 8
Figure 8
Lysosome-associated membrane protein 2 (LAMP-2)–deficient mice spontaneously develop pancreatitis. Pancreatitis responses were measured in LAMP-2 null mice (knockout) at (A) indicated age or (B, C) 6 months of age. Values are mean ± SEM from at least three mice in each group. *P < .05 versus all other groups. Scale bar: 20 μm.
Figure 9
Figure 9
Lysosome-associated membrane protein 2 (LAMP-2) deficiency causes macrophage infiltration and stellate cell activation but not fibrosis in pancreas. Immunofluorescent (A), histochemical (B, E), and immunohistochemical (D) staining of pancreatic tissue sections from 6-month-old wild-type and LAMP-2 knockout mice for markers of macrophages (CD68 and CD206), neutrophils [chloroacetate esterase (CAE)], activated stellate cells (α-SMA), and fibrosis (Goldner trichrome and collagen-1). In (A), nuclei stained with 4′,6-diamidino-2-phenylindole (DAPI). (C). Electron micrograph showing abundant macrophages (M) in pancreas of a 6-month-old LAMP-2 knockout mouse. (F) Immunoblot for α-SMA (α-smooth muscle actin) in pancreas of wild-type and LAMP-2 knockout mice. (G). α-SMA and collagen-1 were quantified on pancreatic tissue sections as the percentage of the positive area. Values are mean ± SEM (n = 3 per group). *P < .05 versus wild type. Scale bars: 10 μm (A, B, D, E) and 2 μm (C).
Figure 10
Figure 10
Lysosome-associated membrane protein 2 (LAMP-2) maintains acinar cell homeostasis. (A–E). Intrapancreatic content of (A) amylase (immunoblot) and (D) trypsinogen [enterokinase assay (see Materials and Methods)], (B) serum amylase level, and (C) ratio to intrapancreatic amylase, and acinar cell zymogen granules (ZG) number (E) were measured in 6-month-old wild-type and LAMP-2 knockout mice. (E) The average ZG number per acinar cell was quantified on electron micrographs of pancreatic tissue sections. (F–H) Intracellular amylase content (F), and the basal and cholecystokinin (CCK)-induced amylase release (G, H) were measured in pancreatic acini isolated from wild-type and LAMP-2 knockout mice and incubated for 30 minutes with and without CCK-8 at indicated concentrations. (H) Amylase release from wild-type or knockout mice was normalized to that in the absence of CCK. Values are mean ± SEM; n = 3–4 mice of each genotype (B–D), 10–12 cells per group (E), 3–4 acinar cell preparations per group (F–H). *P < .05 versus wild type.
Figure 11
Figure 11
Effects of lysosome-associated membrane protein (LAMP) deficiency on acute cerulein (CR) pancreatitis responses. CR pancreatitis was induced as described in Materials and Methods. Histopathologic changes (A; H&E staining) and other parameters of pancreatitis were measured in pancreata (A, C–H) and serum (B) of wild-type and LAMP-2 knockout mice. MPO, myeloperoxidase. Values are mean ± SEM from 3–4 mice per group. *P < .05 versus wild-type saline control; #P < .05 versus wild-type CR; $P < .05 versus LAMP-2 knockout saline control.

References

    1. Peery A.F., Dellon E.S., Lund J. Burden of gastrointestinal disease in the United States: 2012 update. Gastroenterology. 2012;143:1179–1187. - PMC - PubMed
    1. Pandol S.J., Saluja A.K., Imrie C.W. Acute pancreatitis: bench to the bedside. Gastroenterology. 2007;132:1127–1151. [erratum 133:1056] - PubMed
    1. Aho H.J., Nevalainen T.J., Havia V.T. Human acute pancreatitis: a light and electron microscopic study. Acta Pathol Microbiol Immunol Scand A. 1982;90:367–373. - PubMed
    1. Helin H., Mero M., Markkula H. Pancreatic acinar ultrastructure in human acute pancreatitis. Virchows Arch A Pathol Anat Histol. 1980;387:259–270. - PubMed
    1. Watanabe O., Baccino F.M., Steer M.L. Supramaximal caerulein stimulation and ultrastructure of rat pancreatic acinar cell: early morphological changes during development of experimental pancreatitis. Am J Physiol. 1984;246:G457–G467. - PubMed