. 2015 Oct 22;2(6):ENEURO.0075-15.2015.
doi: 10.1523/ENEURO.0075-15.2015. eCollection 2015 Nov-Dec.

Chronic In Vivo Imaging of Ponto-Cerebellar Mossy Fibers Reveals Morphological Stability during Whisker Sensory Manipulation in the Adult Rat

Affiliations

Chronic In Vivo Imaging of Ponto-Cerebellar Mossy Fibers Reveals Morphological Stability during Whisker Sensory Manipulation in the Adult Rat

Daria Rylkova et al. eNeuro. .

Abstract

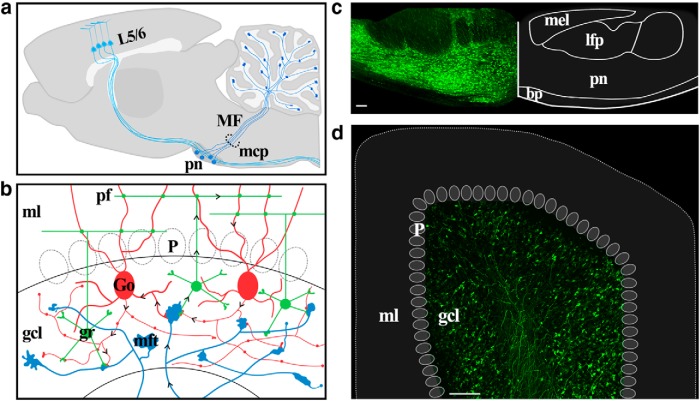
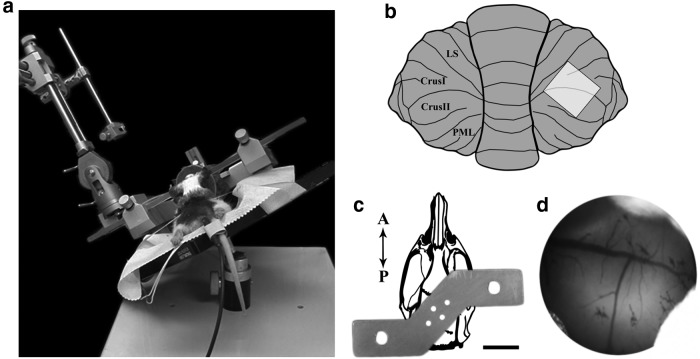
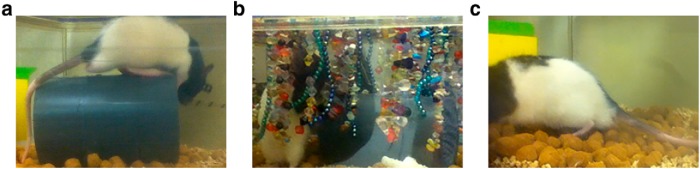
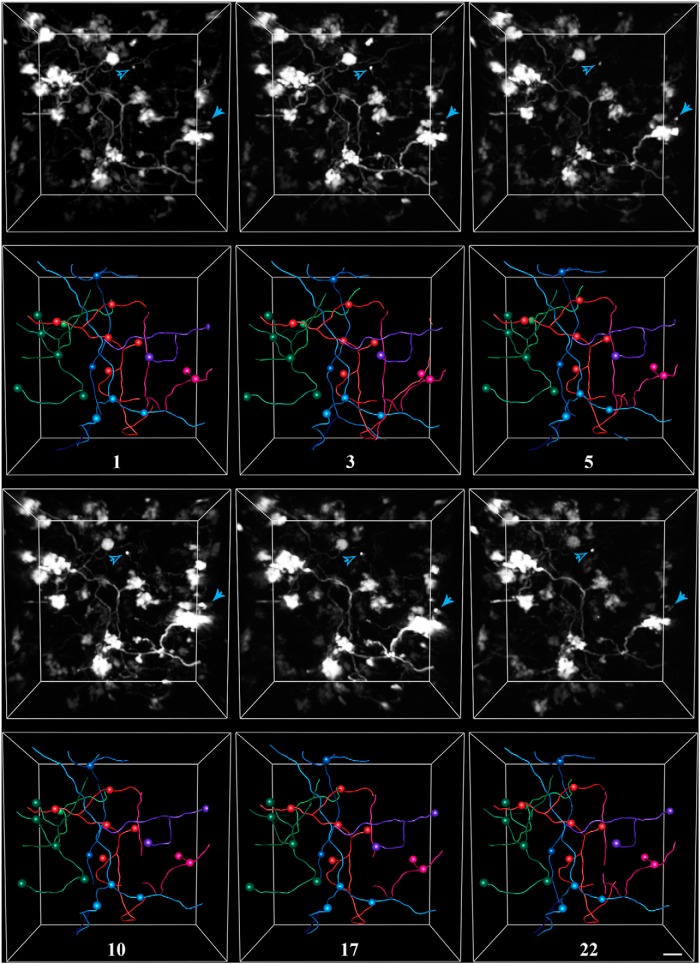
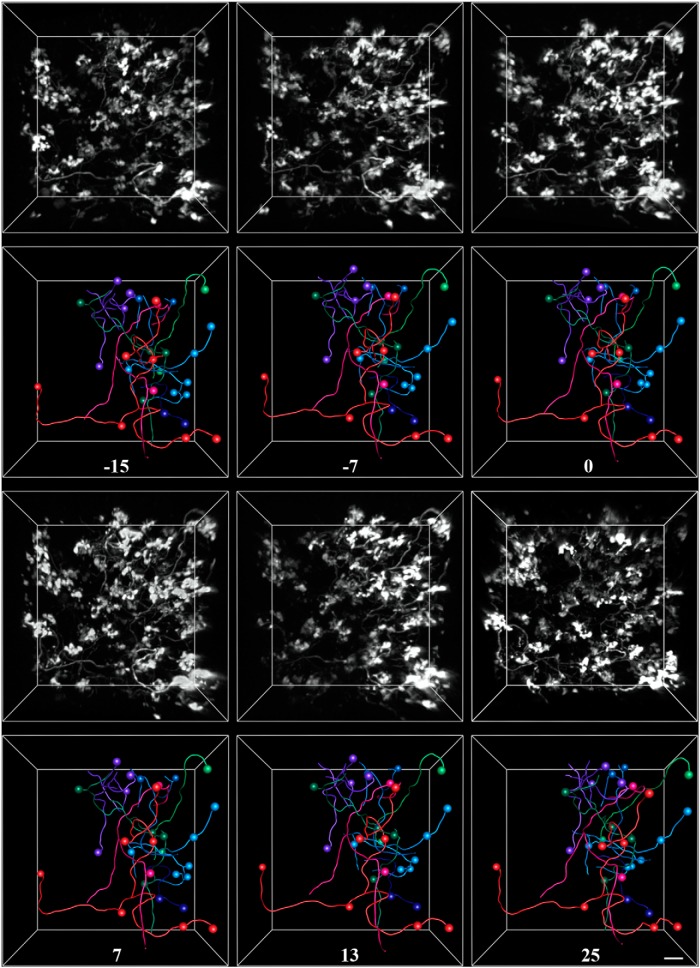
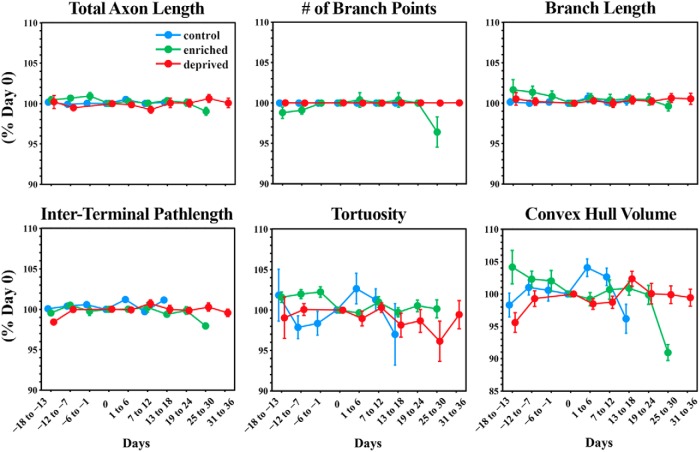
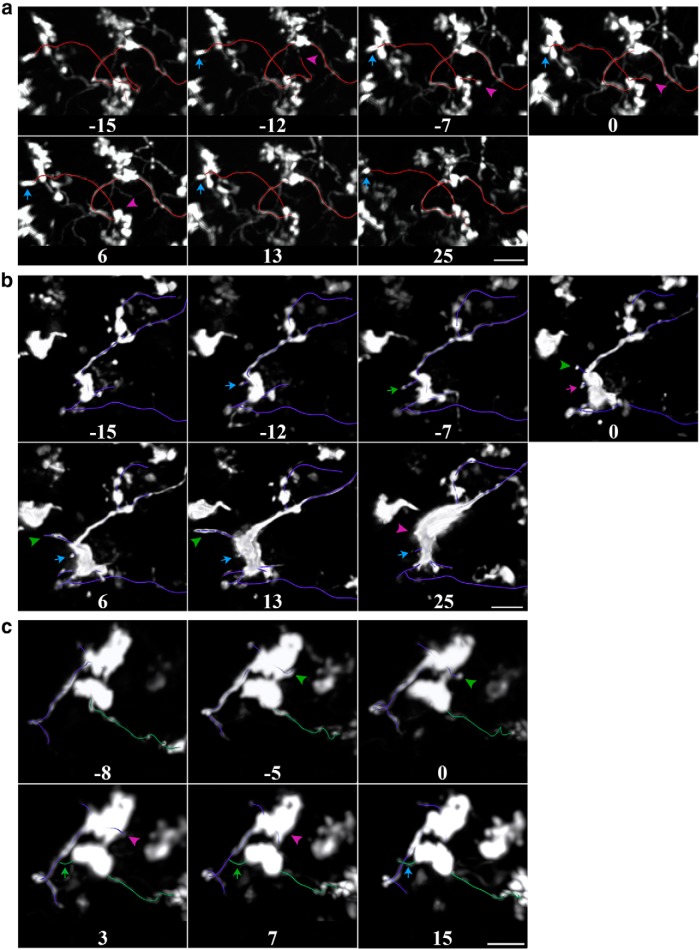
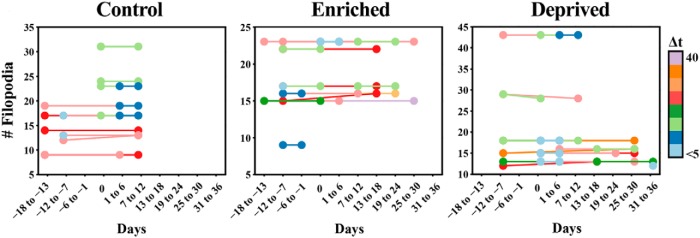
The cerebellum receives extensive disynaptic input from the neocortex via the basal pontine nuclei, the neurons of which send mossy fiber (MF) axons to the granule cell layer of the contralateral cerebellar hemisphere. Although this cortico-cerebellar circuit has been implicated in tasks such as sensory discrimination and motor learning, little is known about the potential role of MF morphological plasticity in the function of the cerebellar granule cell layer. To address this issue, we labeled MFs with EGFP via viral infection of the basal pons in adult rats and performed in vivo two-photon imaging of MFs in Crus I/II of the cerebellar hemisphere over a period of several weeks. Following the acquisition of baseline images, animals were housed in control, enriched, or deprived sensory environments. Morphological dynamics were assessed by tracing MF axons and their terminals, and by tracking the stability of filopodia arising from MF terminal rosettes. MF axons and terminals were found to be remarkably stable. Parameters derived neither from measurements of axonal arbor geometry nor from the morphology of individual rosettes and their filopodial extensions significantly changed under control conditions over 4 weeks of imaging. Increasing whisker stimulation by manipulating the sensory environment or decreasing such stimulation by whisker trimming also failed to alter MF structure. Our studies indicate that pontine MF axons projecting to Crus I/II in adult rats do not undergo significant structural rearrangements over the course of weeks, and that this stability is not altered by the sustained manipulation of whisker sensorimotor experience.

Keywords: cerebellum; in vivo imaging; mossy fiber.


Figures

Figure 1.
Figure 1.
Injection of AAV2/1-EGFP into the basal pons labels ponto-cerebellar mossy fibers in the adult rat. a, A diagram of the cortico-cerebellar circuit. Cortical layer 5/6 pyramidal cells provide ipsilateral input to neurons of the basal pons. Pontine axons travel in the contralateral middle cerebellar peduncle (mcp) and branch throughout the white matter and granule cell layer of the cerebellar hemisphere. b, The granule cell layer microcircuit. Each mossy fiber axon branches over multiple lobules and gives rise to 100–200 terminals. A mossy fiber terminal forms a glomerular synapse with the dendrites of 30–40 granule cells. Granule cells are also innervated by inhibitory Golgi cells. c, EGFP expression in the basal pons revealed by native EGFP fluorescence in a fixed coronal brain slice prepared ∼2 months after the virus injection. This image is a montage of several maximal z-projections, each encompassing ∼30 µm of depth. Note the broad distribution of infected cells within the basal pons. The right portion of the panel shows the labeled boundaries of the basal pontine nuclei and surrounding fiber tracts corresponding to approximately −8.0 mm AP from bregma. d, Immunohistochemistry using an antibody directed against EGFP reveals pontine mossy fibers in Crus IIa of the cerebellar hemisphere contralateral to the injection site. The rat was killed, and slices were prepared ∼2 months after viral injection. bp, Brachium pontis; Go, Golgi cell; gcl, granule cell layer; gr, granule cell; mel, medial lemniscus; mft, mossy fiber terminal; ml, molecular layer; lfp, lateral fasciculus of the pons; P, Purkinje cell; pf, parallel fiber; pn, pontine nuclei. Scale bar, 100 μm.
Figure 2.
Figure 2.
Surgical methods. a, Cranial window surgeries were performed on a modified tilting stereotaxic device to allow for easier access to the lateral cerebellar hemispheres. b, Diagram of the cranial window position overlying lobules Crus I and II. c, Custom headplate used to secure the animal to the imaging apparatus. The headplate is shown overlayed on a drawing of the adult rat skull. Four skull screws and dental cement were used to attach the headplate to the skull. The two holes at the edges of the headplate were used to secure the animal to the imaging stage. Scale bar, 1 cm. d, The surface of the cerebellum viewed through the cranial window. This image is oriented in the same manner as in b.
Figure 3.
Figure 3.
Home-cage conditions for sensory manipulation. a, For control and baseline conditions, animals were given a PVC tube, which they were free to explore. b, The enriched whisker stimulation environment included the PVC tube and a variety of hanging beads. c, For the deprived condition, animals had their whiskers plucked for the duration of imaging, and the PVC tube was removed.
Figure 4.
Figure 4.
Exemplar in vivo images and tracings from a rat housed in control conditions. Pontine mossy fibers expressing EGFP were imaged repeatedly over a 3 week period in the Crus I/II lobules of the cerebellar hemisphere. For each time point, the 3-D-rendered fluorescence image (this is not a z-stack projection) is shown in the top panel, and the corresponding tracing is shown in the bottom panel. Spheres mark the locations of axon terminals. Each color represents a separate axon identified within the volume. The number of days since the volume was first acquired is indicated under each set of tracings. Arrowheads indicate examples of two filopodial processes extending from nearby rosettes, which were stable for the duration of imaging. Scale bar, 10 µm.
Figure 5.
Figure 5.
Exemplar in vivo images and tracings from a rat housed in enriched conditions. Pontine mossy fibers expressing EGFP were imaged repeatedly over a 6 week period in the Crus I/II lobule of the cerebellar hemisphere. For each time point, the 3-D-rendered fluorescence image is shown in the top panel, and the corresponding tracing is shown in the bottom panel. Spheres mark the locations of axon terminals. Each color represents a separate axon identified within the volume. The number of days since the animal was introduced to the enriched environment is indicated under each set of tracings. Scale bar, 10 µm.
Figure 6.
Figure 6.
Exemplar in vivo images and tracings from a rat housed in deprived conditions. Pontine mossy fibers expressing EGFP were imaged repeatedly over a 6 week period in the Crus I/II lobule of the cerebellar hemisphere. For each time point, the 3-D-rendered fluorescence image is shown in the top panel, and the corresponding tracing is shown in the bottom panel. Spheres mark the locations of axon terminals. Each color represents a separate axon identified within the volume. The number of days since the animal was introduced to the deprived environment and had whiskers plucked, is indicated under each set of tracings. Scale bar, 10 µm.
Figure 7.
Figure 7.
Ponto-cerebellar mossy fiber axons are stable in control, enriched, and deprived conditions. Mossy fiber axons were manually traced for each imaging time point. Tracings were used to quantify the morphological parameters of individual mossy fiber axons across time. For the purposes of displaying data, time points were aligned by collecting data into 6 d time bins. Day 0 is the day animals were introduced into sensory enriched or deprived housing conditions. For the control group, day 0 was taken as the approximate midpoint of imaging. Data were normalized and are reported as the percentage of day 0. Data are presented as the mean ± SEM. Total axon length shows the mean percentage change in the total length of individual axons. The number of branch points refers to the total number of branch points per axon. Branch length was measured for individual axonal branches. Interterminal path length refers to the axonal path length separating two terminals. Tortuosity was calculated as the ratio of the Euclidian distance between two terminal points and the axonal path length between those points of individual axons. The term “convex hull volume” refers to the convex hull volume of individual axons.
Figure 8.
Figure 8.
Examples of rare mossy fiber branch and filopodial dynamics captured in vivo. a, Time series showing the retraction of an axonal branch over a 2–3 week period. The large mossy fiber terminal at the center gives rise to two branches ending in small terminals. The branch to the left (arrow) remains stable, whereas the one on the right (arrowhead) retracts. b, c, Examples of two dynamic filopodia (arrow and arrowhead) on a single mossy fiber terminal. Blue, stable; magenta, retracting; green, extending compared with the previous time point. All examples are snapshots of the 3-D-rendered volume and were taken from the enriched group. Days since the animal was introduced to the enriched environment are indicated at the bottom of each image. Scale bar, 10 µm.
Figure 9.
Figure 9.
Filopodia emitted from mossy fiber terminals are stable in control, enriched, and deprived conditions. A subset of filopodial protrusions arising from mossy fiber terminal rosettes were marked in several volumes and time points for each animal. The panels show the number of filopodia identified in one time point that were also present in a second time point for the control, enriched, and deprived groups, respectively. The time interval between comparisons is color coded. With few exceptions, all filopodia identified in one time point were also present in another time point regardless of the time interval. The number of added or lost filopodial protrusions never exceeded one in a given imaging volume.

Similar articles

Cited by

References

    1. Allen GI, Tsukahara N (1974) Cerebrocerebellar communication systems. Physiol Rev 54:957-1006. - PubMed
    1. Allen GI, Korn H, Oshima T, Toyama K (1975) Mode of synaptic linkage in cerebro-ponto-cerebellar pathway of cat. II. Responses of single cells in pontine nuclei. Exp Brain Res 24:15-36. 10.1007/BF00236015 - DOI - PubMed
    1. Alloway KD, Smith JB, Beauchemin KJ (2010) Quantitative analysis of the bilateral brainstem projections from the whisker and forepaw regions in rat primary motor cortex. J Comp Neurol 518:4546-4566. 10.1002/cne.22477 - DOI - PMC - PubMed
    1. Beitz A, Larson A, Monaghan P, Altschuler R, Mullett M, Madl J (1986) Immunohistochemical localization of glutamate, glutaminase and aspartate-aminotransferase in neurons of the pontine nuclei of the rat. Neuroscience 17:741-753. - PubMed
    1. Bower JM, Beermann DH, Gibson JM, Shambes GM, Welker W (1981) Principles of organization of a cerebro-cerebellar circuit. micromapping the projections from cerebral (SI) to cerebellar (granule cell layer) tactile areas of rats. Brain Behav Evol 18:1-18. - PubMed

Publication types

LinkOut - more resources