

Microbial nitrogen dynamics in organic and mineral soil horizons along a latitudinal transect in western Siberia
- PMID: 26693204
- PMCID: PMC4676305
- DOI: 10.1002/2015GB005084
Microbial nitrogen dynamics in organic and mineral soil horizons along a latitudinal transect in western Siberia
Abstract
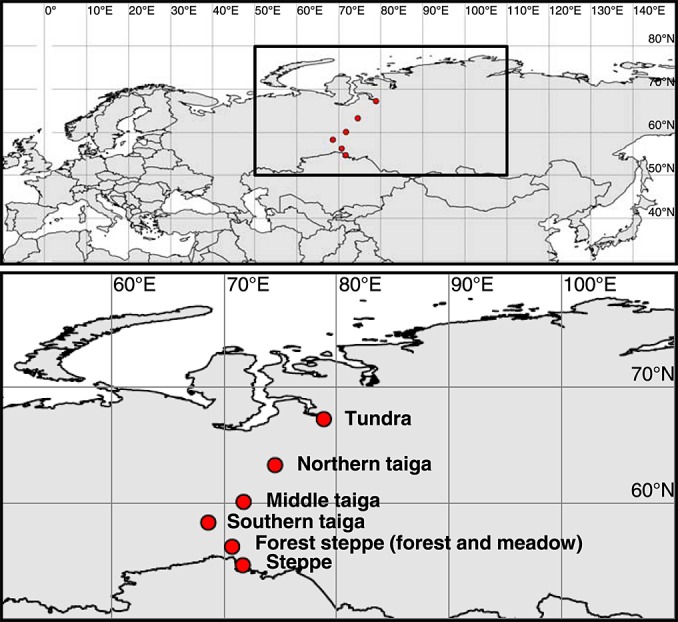
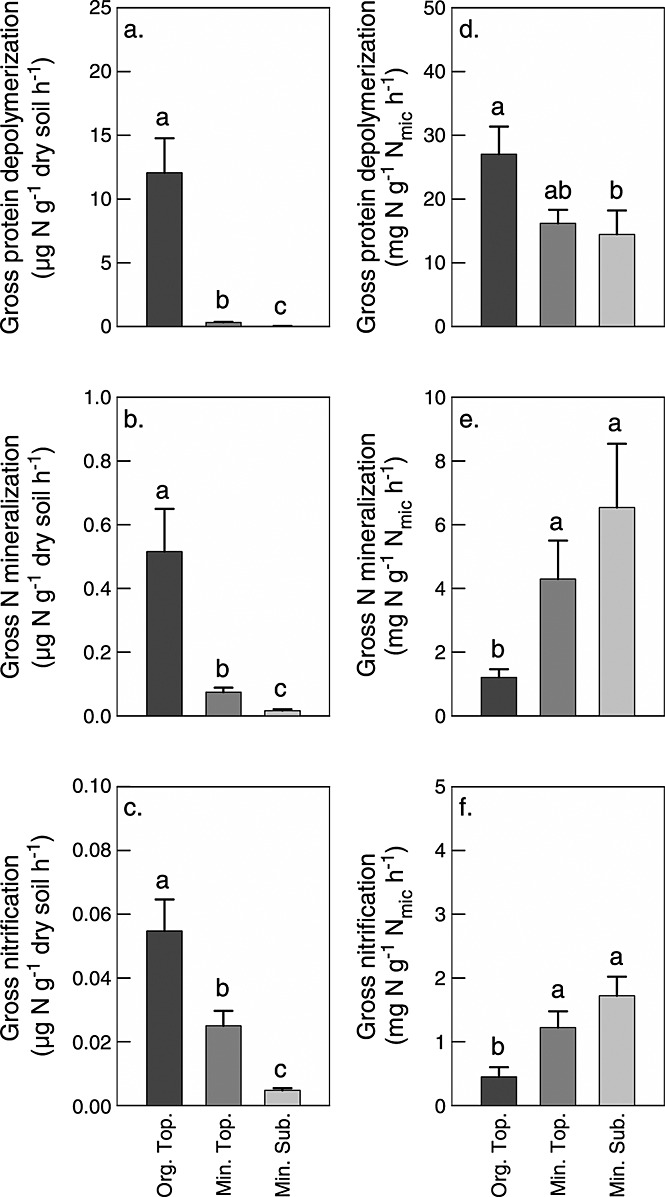
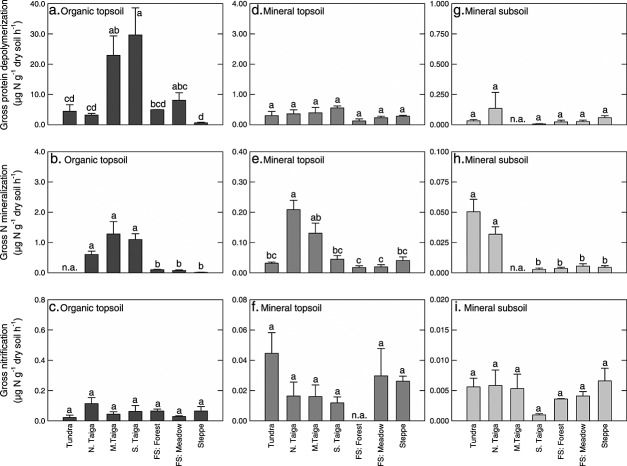
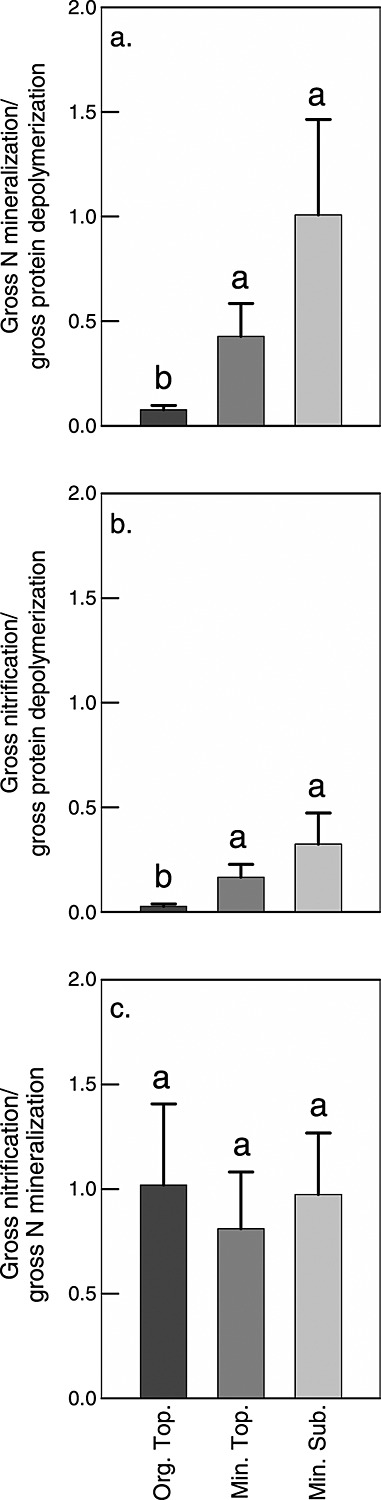
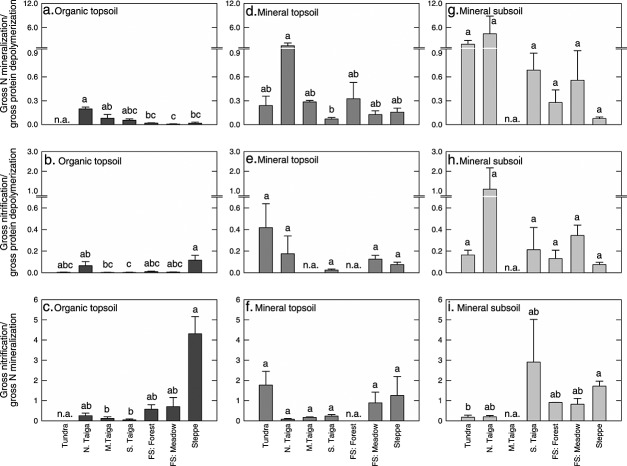
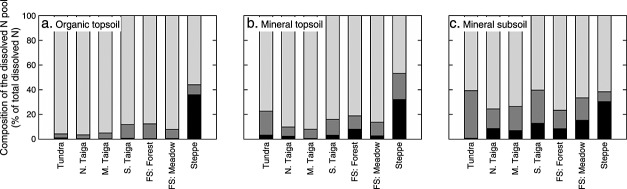
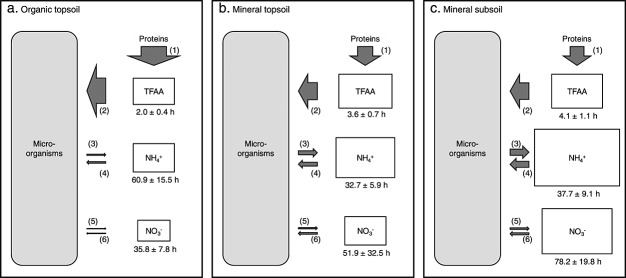
Soil N availability is constrained by the breakdown of N-containing polymers such as proteins to oligopeptides and amino acids that can be taken up by plants and microorganisms. Excess N is released from microbial cells as ammonium (N mineralization), which in turn can serve as substrate for nitrification. According to stoichiometric theory, N mineralization and nitrification are expected to increase in relation to protein depolymerization with decreasing N limitation, and thus from higher to lower latitudes and from topsoils to subsoils. To test these hypotheses, we compared gross rates of protein depolymerization, N mineralization and nitrification (determined using 15N pool dilution assays) in organic topsoil, mineral topsoil, and mineral subsoil of seven ecosystems along a latitudinal transect in western Siberia, from tundra (67°N) to steppe (54°N). The investigated ecosystems differed strongly in N transformation rates, with highest protein depolymerization and N mineralization rates in middle and southern taiga. All N transformation rates decreased with soil depth following the decrease in organic matter content. Related to protein depolymerization, N mineralization and nitrification were significantly higher in mineral than in organic horizons, supporting a decrease in microbial N limitation with depth. In contrast, we did not find indications for a decrease in microbial N limitation from arctic to temperate ecosystems along the transect. Our findings thus challenge the perception of ubiquitous N limitation at high latitudes, but suggest a transition from N to C limitation of microorganisms with soil depth, even in high-latitude systems such as tundra and boreal forest.
Key points: We compared soil N dynamics of seven ecosystems along a latitudinal transectShifts in N dynamics suggest a decrease in microbial N limitation with depthWe found no decrease in microbial N limitation from arctic to temperate zones.
Keywords: boreal forest; permafrost; protein depolymerization; tundra.
Figures
References
-
- Allison SD, Czimczik CI. Treseder KK. Microbial activity and soil respiration under nitrogen addition in Alaskan boreal forest. Global Change Biol. 2008;14(5):1156–1168. doi: 10.1111/j.1365-2486.2008.01549.x. - DOI
-
- Aulchenko YS, Ripke S, Isaacs A. van Duijn CM. GenABEL: An R library for genome-wide association analysis. Bioinformatics. 2007;23(10):1294–1296. doi: 10.1093/bioinformatics/btm108. - DOI - PubMed
-
- Booth MS, Stark JM. Rastetter E. Controls on nitrogen cycling in terrestrial ecosystems: A synthetic analysis of literature data. Ecol. Monogr. 2005;75(2):139–157. doi: 10.1890/04-0988. - DOI
-
- Brookes PC, Landman A, Pruden G. Jenkinson DS. Chloroform fumigation and the release of soil nitrogen: A rapid direct extraction method to measure microbial biomass nitrogen in soil. Soil Biol. Biochem. 1985;17:837–842. doi: 10.1016/0038-0717(85)90144-0. - DOI
-
- Cornwell WK, et al. Plant species traits are the predominant control on litter decomposition rates within biomes worldwide. Ecol. Lett. 2008;11:1065–1071. doi: 10.1111/j.1461-0248.2008.01219.x. - DOI - PubMed
Grants and funding
LinkOut - more resources
Full Text Sources