Bi-Allelic TCRα or β Recombination Enhances T Cell Development but Is Dispensable for Antigen Responses and Experimental Autoimmune Encephalomyelitis
- PMID: 26693713
- PMCID: PMC4687847
- DOI: 10.1371/journal.pone.0145762
Bi-Allelic TCRα or β Recombination Enhances T Cell Development but Is Dispensable for Antigen Responses and Experimental Autoimmune Encephalomyelitis
Abstract
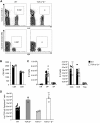
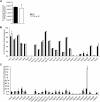
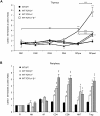
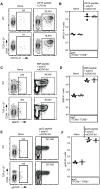
Dual TCRα-expressing T cells outnumber dual TCRβ-expressing cells by ~10:1. As a result, efforts to understand how dual TCR T cells impact immunity have focused on dual TCRα expression; dual TCRβ expression remains understudied. We recently demonstrated, however, that dual TCRβ expression accelerated disease in a TCR transgenic model of autoimmune arthritis through enhanced positive selection efficiency, indicating that dual TCRβ expression, though rare, can impact thymic selection. Here we generated mice hemizygous for TCRα, TCRβ, or both on the C57BL/6 background to investigate the impact bi-allelic TCR chain recombination has on T cell development, repertoire diversity, and autoimmunity. Lack of bi-allelic TCRα or TCRβ recombination reduced αβ thymocyte development efficiency, and the absence of bi-allelic TCRβ recombination promoted γδ T cell development. However, we observed no differences in the numbers of naïve and expanded antigen-specific T cells between TCRα+/-β+/- and wildtype mice, and TCR repertoire analysis revealed only subtle differences in Vβ gene usage. Finally, the absence of dual TCR T cells did not impact induced experimental autoimmune encephalomyelitis pathogenesis. Thus, despite more stringent allelic exclusion of TCRβ relative to TCRα, bi-allelic TCRβ expression can measurably impact thymocyte development and is necessary for maintaining normal αβ/γδ T cell proportions.
Conflict of interest statement
Figures


Similar articles
-
The requirement for pre-TCR during thymic differentiation enforces a developmental pause that is essential for V-DJβ rearrangement.PLoS One. 2011;6(6):e20639. doi: 10.1371/journal.pone.0020639. Epub 2011 Jun 3. PLoS One. 2011. PMID: 21673984 Free PMC article.
-
Regulation of T cell receptor (TCR) beta gene expression by CD3 complex signaling in immature thymocytes: implications for TCRbeta allelic exclusion.Proc Natl Acad Sci U S A. 1999 Mar 30;96(7):3882-7. doi: 10.1073/pnas.96.7.3882. Proc Natl Acad Sci U S A. 1999. PMID: 10097132 Free PMC article.
-
RRAS2 shapes the TCR repertoire by setting the threshold for negative selection.J Exp Med. 2019 Oct 7;216(10):2427-2447. doi: 10.1084/jem.20181959. Epub 2019 Jul 19. J Exp Med. 2019. PMID: 31324740 Free PMC article.
-
Dynamic aspects of TCRalpha gene recombination: qualitative and quantitative assessments of the TCRalpha chain repertoire in man and mouse.Adv Exp Med Biol. 2009;650:82-92. doi: 10.1007/978-1-4419-0296-2_7. Adv Exp Med Biol. 2009. PMID: 19731803 Review.
-
Regulation of TCR alpha and beta gene allelic exclusion during T-cell development.Immunol Today. 1992 Aug;13(8):315-22. doi: 10.1016/0167-5699(92)90044-8. Immunol Today. 1992. PMID: 1324691 Review.
Cited by
-
Immune Repertoires in Various Dermatologic and Autoimmune Diseases.Genes (Basel). 2024 Dec 11;15(12):1591. doi: 10.3390/genes15121591. Genes (Basel). 2024. PMID: 39766858 Free PMC article. Review.
-
Cutting Edge: Dual TCRα Expression Poses an Autoimmune Hazard by Limiting Regulatory T Cell Generation.J Immunol. 2017 Jul 1;199(1):33-38. doi: 10.4049/jimmunol.1700406. Epub 2017 May 24. J Immunol. 2017. PMID: 28539428 Free PMC article.
-
Dual TCR T Cells: Identity Crisis or Multitaskers?J Immunol. 2019 Feb 1;202(3):637-644. doi: 10.4049/jimmunol.1800904. J Immunol. 2019. PMID: 30670579 Free PMC article. Review.
-
Dual TCR-Expressing T Cells in Cancer: How Single-Cell Technologies Enable New Investigation.Immunohorizons. 2023 May 1;7(5):299-306. doi: 10.4049/immunohorizons.2200062. Immunohorizons. 2023. PMID: 37129560 Free PMC article.
-
Evaluation of the capacities of mouse TCR profiling from short read RNA-seq data.PLoS One. 2018 Nov 15;13(11):e0207020. doi: 10.1371/journal.pone.0207020. eCollection 2018. PLoS One. 2018. PMID: 30439982 Free PMC article.
References
-
- Burnet FM. The clonal selection theory of acquired immunity. Nashville: Vanderbilt University Press; 1959. xiii, 209 p.p.
-
- Gartner F, Alt FW, Monroe R, Chu M, Sleckman BP, Davidson L, et al. Immature thymocytes employ distinct signaling pathways for allelic exclusion versus differentiation and expansion. Immunity. 1999;10(5):537–46. Epub 1999/06/15. S1074-7613(00)80053-9 [pii]. . - PubMed
-
- Sarukhan A, Garcia C, Lanoue A, von Boehmer H. Allelic inclusion of T cell receptor alpha genes poses an autoimmune hazard due to low-level expression of autospecific receptors. Immunity. 1998;8(5):563–70. Epub 1998/06/10. S1074-7613(00)80561-0 [pii]. . - PubMed
Publication types
MeSH terms
Substances
Grants and funding
LinkOut - more resources
Full Text Sources
Other Literature Sources
Research Materials

