

Texture Analysis of T2-Weighted MR Images to Assess Acute Inflammation in Brain MS Lesions
- PMID: 26693908
- PMCID: PMC4687842
- DOI: 10.1371/journal.pone.0145497
Texture Analysis of T2-Weighted MR Images to Assess Acute Inflammation in Brain MS Lesions
Abstract
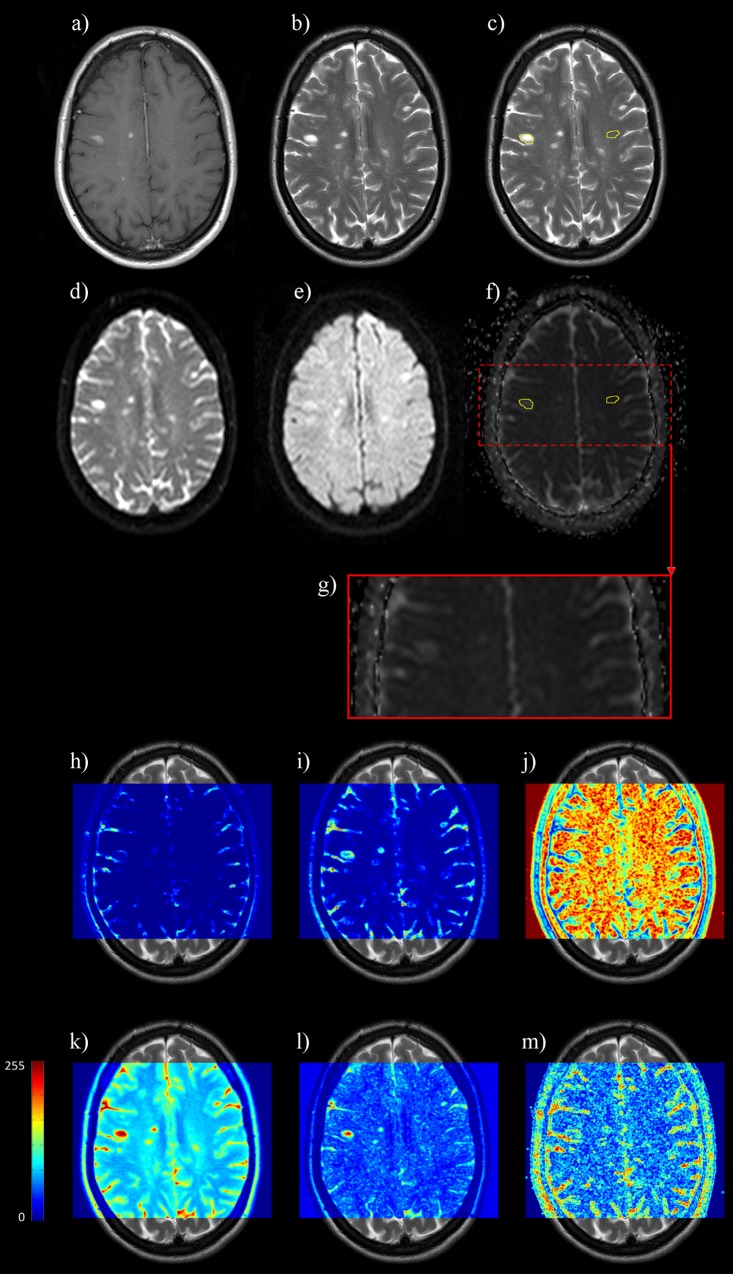
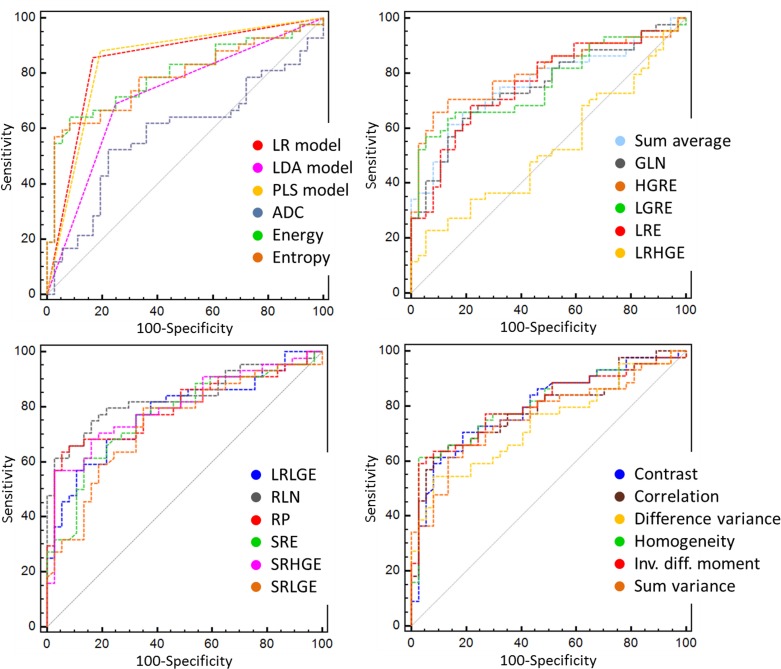
Brain blood barrier breakdown as assessed by contrast-enhanced (CE) T1-weighted MR imaging is currently the standard radiological marker of inflammatory activity in multiple sclerosis (MS) patients. Our objective was to evaluate the performance of an alternative model assessing the inflammatory activity of MS lesions by texture analysis of T2-weighted MR images. Twenty-one patients with definite MS were examined on the same 3.0T MR system by T2-weighted, FLAIR, diffusion-weighted and CE-T1 sequences. Lesions and mirrored contralateral areas within the normal appearing white matter (NAWM) were characterized by texture parameters computed from the gray level co-occurrence and run length matrices, and by the apparent diffusion coefficient (ADC). Statistical differences between MS lesions and NAWM were analyzed. ROC analysis and leave-one-out cross-validation were performed to evaluate the performance of individual parameters, and multi-parametric models using linear discriminant analysis (LDA), partial least squares (PLS) and logistic regression (LR) in the identification of CE lesions. ADC and all but one texture parameter were significantly different within white matter lesions compared to within NAWM (p < 0.0167). Using LDA, an 8-texture parameter model identified CE lesions with a sensitivity Se = 70% and a specificity Sp = 76%. Using LR, a 10-texture parameter model performed better with Se = 86% / Sp = 84%. Using PLS, a 6-texture parameter model achieved the highest accuracy with Se = 88% / Sp = 81%. Texture parameter from T2-weighted images can assess brain inflammatory activity with sufficient accuracy to be considered as a potential alternative to enhancement on CE T1-weighted images.
Conflict of interest statement
Figures
Similar articles
-
Quantitative texture analysis of brain white matter lesions derived from T2-weighted MR images in MS patients with clinically isolated syndrome.J Neuroradiol. 2015 Apr;42(2):99-114. doi: 10.1016/j.neurad.2014.05.006. Epub 2014 Jun 23. J Neuroradiol. 2015. PMID: 24970463
-
Robust texture features for response monitoring of glioblastoma multiforme on T1-weighted and T2-FLAIR MR images: a preliminary investigation in terms of identification and segmentation.Med Phys. 2010 Apr;37(4):1722-36. doi: 10.1118/1.3357289. Med Phys. 2010. PMID: 20443493
-
Application of Texture Analysis in Diagnosis of Multiple Sclerosis by Magnetic Resonance Imaging.Glob J Health Sci. 2015 Mar 30;7(6):68-78. doi: 10.5539/gjhs.v7n6p68. Glob J Health Sci. 2015. PMID: 26153164 Free PMC article.
-
Diffusion-weighted MR of the brain: methodology and clinical application.Radiol Med. 2005 Mar;109(3):155-97. Radiol Med. 2005. PMID: 15775887 Review. English, Italian.
-
Characterization of tissue damage in multiple sclerosis by nuclear magnetic resonance.Philos Trans R Soc Lond B Biol Sci. 1999 Oct 29;354(1390):1675-86. doi: 10.1098/rstb.1999.0511. Philos Trans R Soc Lond B Biol Sci. 1999. PMID: 10603619 Free PMC article. Review.
Cited by
-
The Use of Noncontrast Quantitative MRI to Detect Gadolinium-Enhancing Multiple Sclerosis Brain Lesions: A Systematic Review and Meta-Analysis.AJNR Am J Neuroradiol. 2017 Jul;38(7):1317-1322. doi: 10.3174/ajnr.A5209. Epub 2017 May 18. AJNR Am J Neuroradiol. 2017. PMID: 28522663 Free PMC article.
-
Diagnostic value of alternative techniques to gadolinium-based contrast agents in MR neuroimaging-a comprehensive overview.Insights Imaging. 2019 Aug 23;10(1):84. doi: 10.1186/s13244-019-0771-1. Insights Imaging. 2019. PMID: 31444580 Free PMC article. Review.
-
Multiple Immune-Inflammatory and Oxidative and Nitrosative Stress Pathways Explain the Frequent Presence of Depression in Multiple Sclerosis.Mol Neurobiol. 2018 Aug;55(8):6282-6306. doi: 10.1007/s12035-017-0843-5. Epub 2018 Jan 2. Mol Neurobiol. 2018. PMID: 29294244 Free PMC article. Review.
-
Automated Segmentation of Tissues Using CT and MRI: A Systematic Review.Acad Radiol. 2019 Dec;26(12):1695-1706. doi: 10.1016/j.acra.2019.07.006. Epub 2019 Aug 10. Acad Radiol. 2019. PMID: 31405724 Free PMC article.
-
Deep Learning for Predicting Enhancing Lesions in Multiple Sclerosis from Noncontrast MRI.Radiology. 2020 Feb;294(2):398-404. doi: 10.1148/radiol.2019191061. Epub 2019 Dec 17. Radiology. 2020. PMID: 31845845 Free PMC article.
References
-
- Polman CH, Reingold SC, Edan G, Filippi M, Hartung HP, Kappos L, et al.: Diagnostic criteria for multiple sclerosis: 2005 revisions to the “McDonald criteria”. Ann Neurol. 2005; 58: 840–846. - PubMed
MeSH terms
LinkOut - more resources
Full Text Sources
Other Literature Sources
Medical
