. 2015 Dec 22;11(12):e1005711.
doi: 10.1371/journal.pgen.1005711. eCollection 2015 Dec.

Genetic Architecture of Atherosclerosis in Mice: A Systems Genetics Analysis of Common Inbred Strains

Affiliations

Genetic Architecture of Atherosclerosis in Mice: A Systems Genetics Analysis of Common Inbred Strains

Brian J Bennett et al. PLoS Genet. .

Erratum in

Abstract

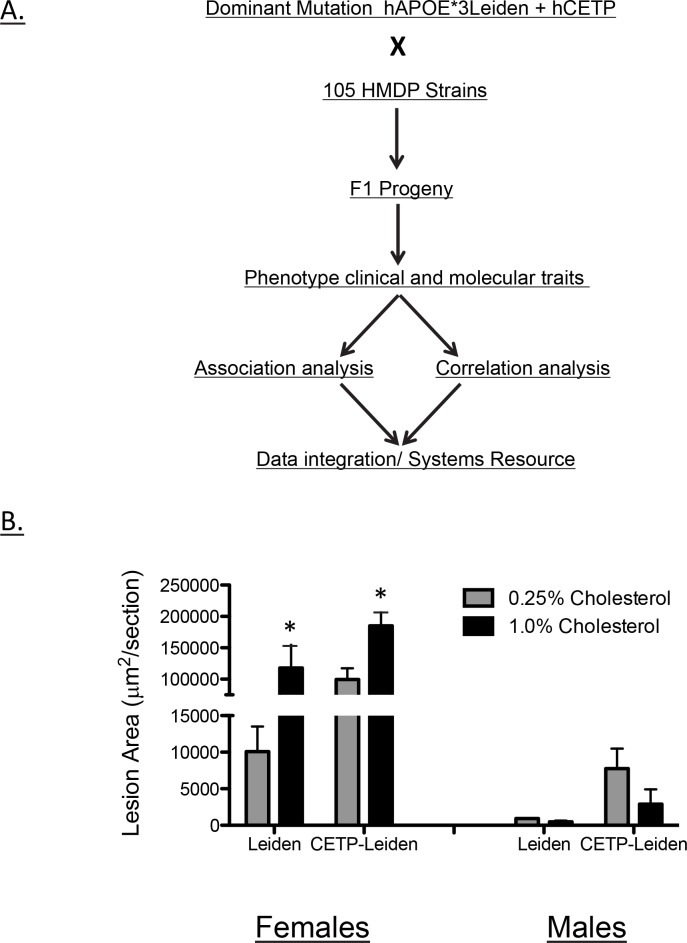
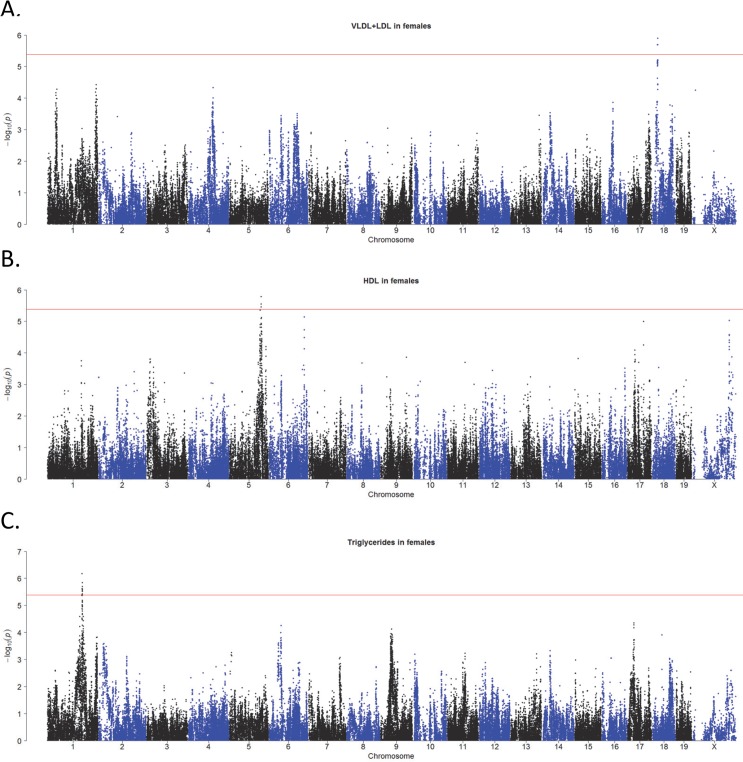
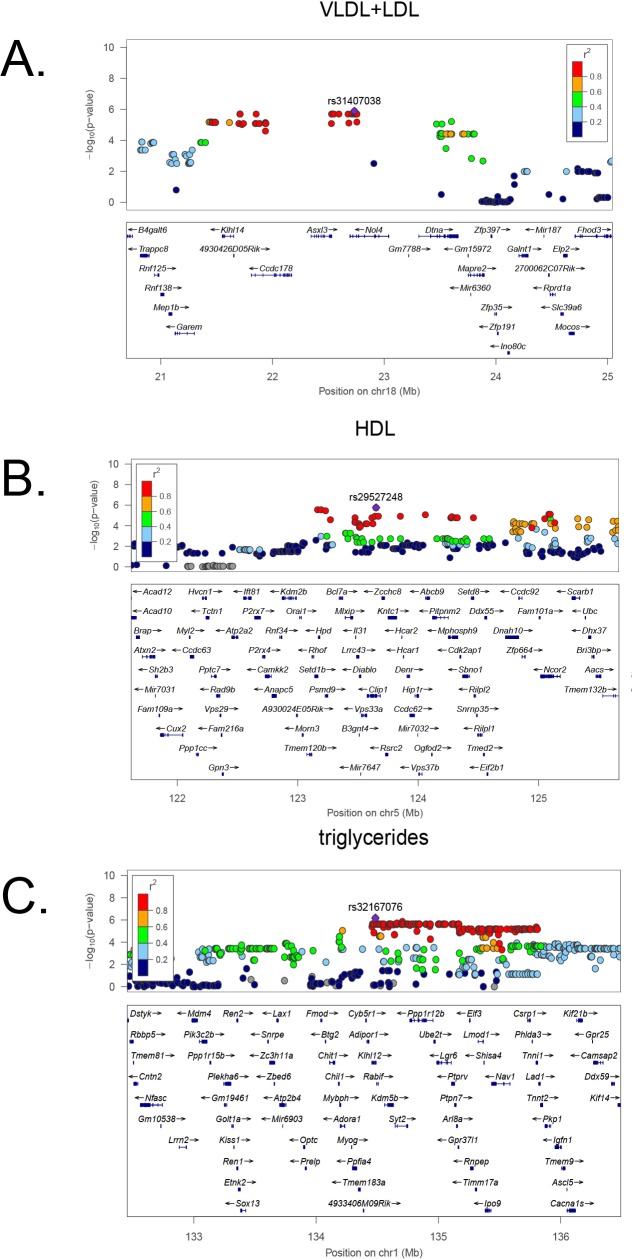
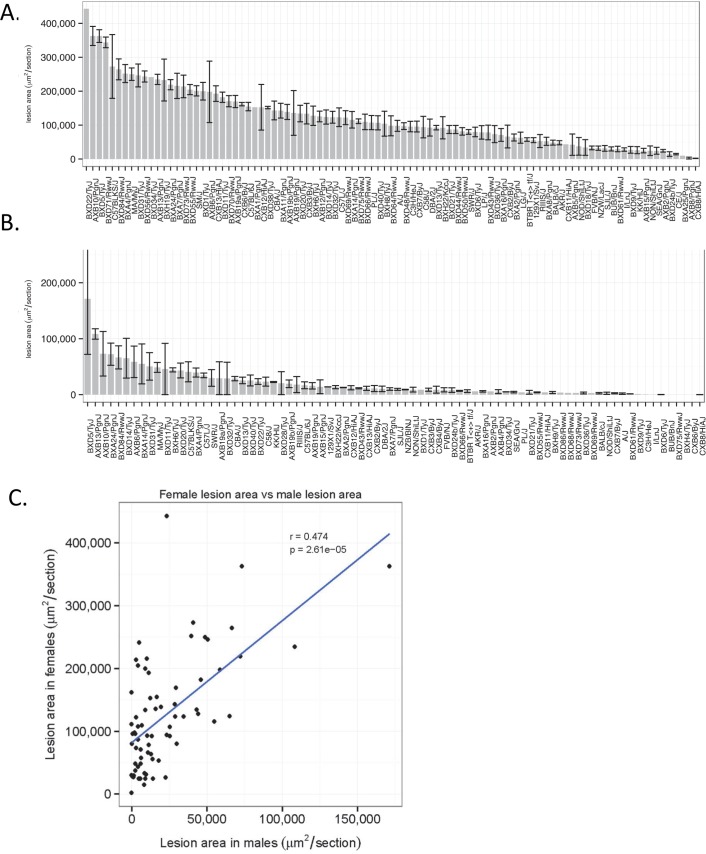
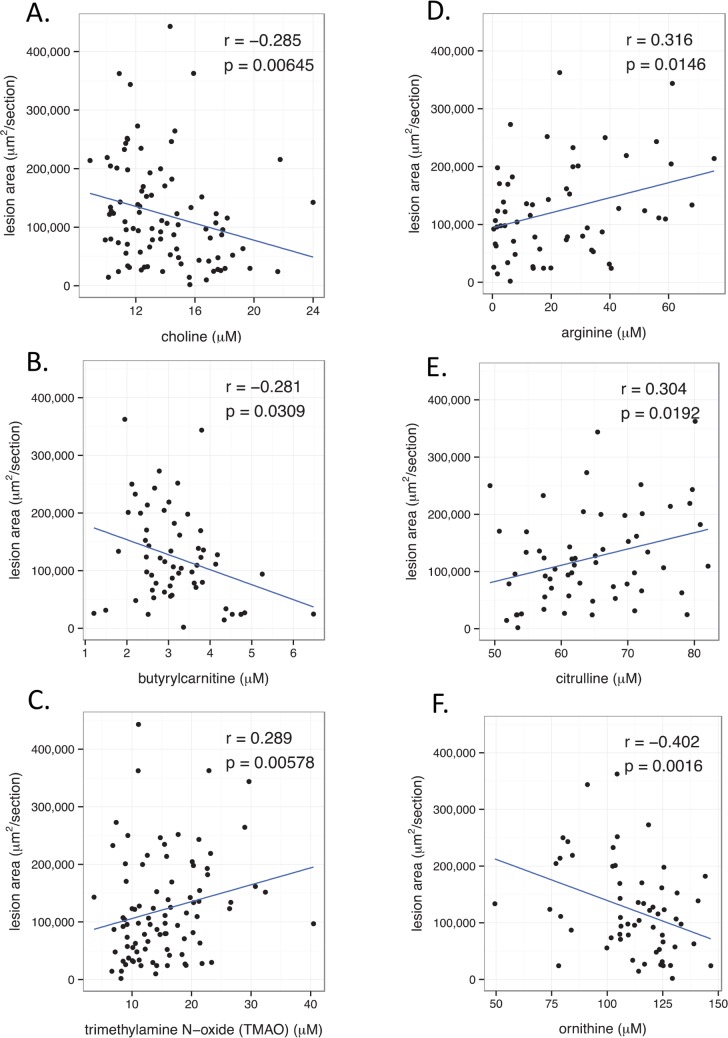
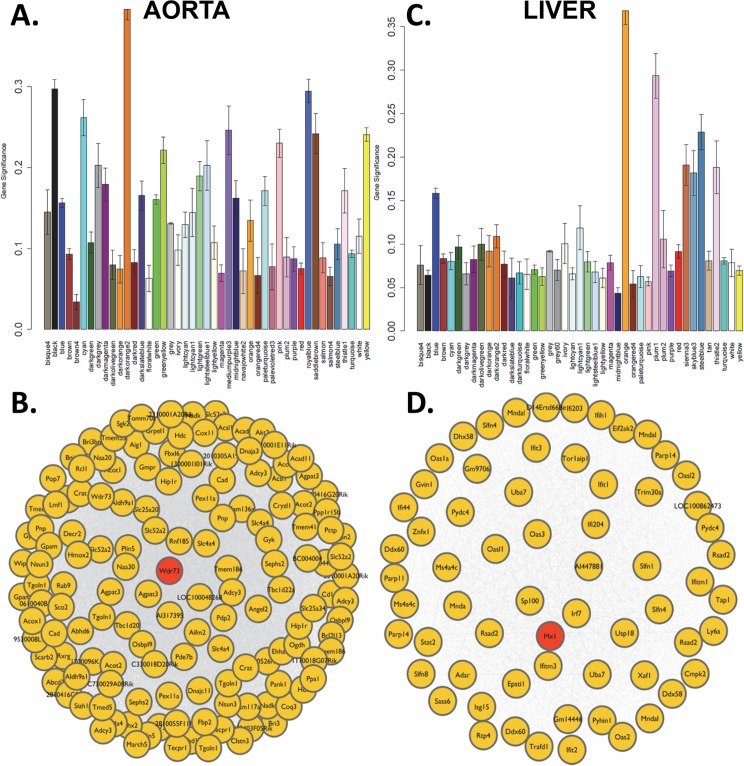
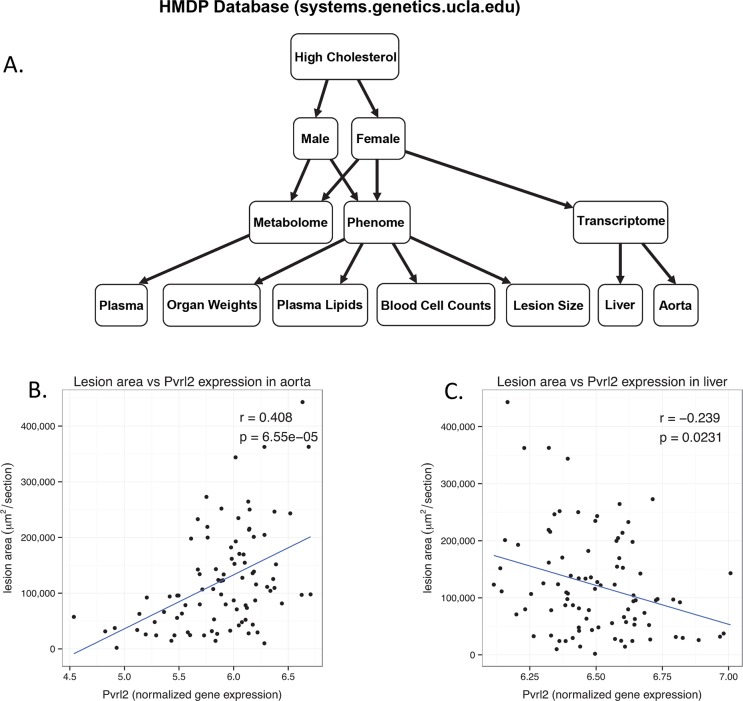
Common forms of atherosclerosis involve multiple genetic and environmental factors. While human genome-wide association studies have identified numerous loci contributing to coronary artery disease and its risk factors, these studies are unable to control environmental factors or examine detailed molecular traits in relevant tissues. We now report a study of natural variations contributing to atherosclerosis and related traits in over 100 inbred strains of mice from the Hybrid Mouse Diversity Panel (HMDP). The mice were made hyperlipidemic by transgenic expression of human apolipoprotein E-Leiden (APOE-Leiden) and human cholesteryl ester transfer protein (CETP). The mice were examined for lesion size and morphology as well as plasma lipid, insulin and glucose levels, and blood cell profiles. A subset of mice was studied for plasma levels of metabolites and cytokines. We also measured global transcript levels in aorta and liver. Finally, the uptake of acetylated LDL by macrophages from HMDP mice was quantitatively examined. Loci contributing to the traits were mapped using association analysis, and relationships among traits were examined using correlation and statistical modeling. A number of conclusions emerged. First, relationships among atherosclerosis and the risk factors in mice resemble those found in humans. Second, a number of trait-loci were identified, including some overlapping with previous human and mouse studies. Third, gene expression data enabled enrichment analysis of pathways contributing to atherosclerosis and prioritization of candidate genes at associated loci in both mice and humans. Fourth, the data provided a number of mechanistic inferences; for example, we detected no association between macrophage uptake of acetylated LDL and atherosclerosis. Fifth, broad sense heritability for atherosclerosis was much larger than narrow sense heritability, indicating an important role for gene-by-gene interactions. Sixth, stepwise linear regression showed that the combined variations in plasma metabolites, including LDL/VLDL-cholesterol, trimethylamine N-oxide (TMAO), arginine, glucose and insulin, account for approximately 30 to 40% of the variation in atherosclerotic lesion area. Overall, our data provide a rich resource for studies of complex interactions underlying atherosclerosis.


Conflict of interest statement

Authors MY, TK and PSG are employees and shareholders of Bristol-Myers Squibb.

Figures

Fig 1
Fig 1. Strategy for construction and analysis of Ath-HMDP mice.
(A) Flow diagram for construction and analysis of Ath-HDMP mice. Male C57BL/6 mice carrying the dominant human transgenes for ApoE*3 Leiden and CETP were mated with 105 inbred strains from the hybrid mouse diversity panel (HMDP). Beginning at 8 weeks of age, F1 progeny carrying both transgenes were placed on a high-fat diet containing either 1.0% or 0.25% cholesterol for 16 weeks and then measured for a panel of atherosclerosis-related traits. Association and correlative analysis was used to map genetic variation underlying these traits and to identify associated pathways. (B) Impact on atherosclerotic lesion area (μm2/section) of dietary cholesterol, sex and hAPOE*3Leiden and combined hAPOE*3Leiden/hCETP transgenes on mice (C57BL/6J background) Note scale break at 50,000 μm2/section. The diet containing 1.0% cholesterol was associated with a significant increase in atherosclerotic lesion area in females (*, p < 0.05) but not in males.
Fig 2
Fig 2. Plasma lipids in the Ath-HMDP.
Genome wide association plots for very low-density lipoproteins, VLDL, and low-density lipoproteins, LDL (A). High density lipoproteins, HDL (B), and Triglycerides (C).
Fig 3
Fig 3. High resolution regional plots of plasma lipid loci in Ath-HMDP.
Locus Zoom plots [118] are shown for the VLDL+LDL locus on Chr 18 (A), the HDL locus on Chr 5 (B) and the triglycerides locus on Chr 1 (C). Physical locations of genes are denoted by blue horizontal bars. The linkage disequilibrium (LD) of the SNPs with the lead SNP at the locus is denoted by the color of the SNP. Red indicates SNPs that are highly correlated (in strong LD with each other) and defines the critical region for candidate gene selection.
Fig 4
Fig 4. Atherosclerosis in Ath-HMDP mice.
Atherosclerotic lesion size (μm2 ± SEM) in the proximal aorta and aortic sinus were quantitated for 697 female mice (A) and 281 male mice (B) using oil red—O staining. In each panel, strains are arranged in rank order by strain-average lesion area. (C) Correlation between strain-average lesion areas in male and female Ath-HMDP mice.
Fig 5
Fig 5. Genetic regulation of atherosclerotic lesion area in HMDP mice.
Loci detected for aortic sinus lesion area are shown for (A) female mice, (B) male mice. The X-axis shows genomic position while the Y-axis indicates −log10 of the p-value following correction for population structure, as described in Methods. The horizontal red line indicates the HMDP cutoff for genome-wide significance; p = 4.2 X 10⁻⁶. [12] (C, D) LocusZoom plots [118] of the genetic association results are shown for (C) female mice and (D) male mice. Physical locations of genes are denoted by blue horizontal bars. The linkage disequilibrium (LD) of the SNPs with the lead SNP at the locus is denoted by the color of the SNP. Red indicates SNPs that are highly correlated (in strong LD with each other) and defines the critical region for candidate gene selection.
Fig 6
Fig 6. Circulating KC levels are under genetic regulation and correlate with atherosclerosis in the Ath-HMDP.
Plasma levels of KC (keratinocyte-derived chemokine)(pg/ml), a homolog of human Il-8 were quantitated for 676 female mice. Strain-average levels of KC (± SEM) are arranged by decreasing rank order (A). Association mapping identified a single strong locus on Chr 1 for plasma KC (B). X-axis is genomic position and Y-axis is −log10 of the p-value for association following correction for population structure, as described in Methods. The horizontal red line indicates the HMDP cutoff for genome-wide significance; p = 4.2 X 10⁻⁶. [12] Correlation between atherosclerosis and plasma KC levels (C). Individual points indicate strain averages for atherosclerotic lesion area (μm2/section) and KC (pg/ml).
Fig 7
Fig 7. Uptake of DiI-AcLDL by peritoneal macrophages in HMDP mice.
(A) Representative fluorescence levels following culture of peritoneal macrophages in control cultures and cultures labeled with DiI-AcLDL in the absence or presence AcLDL competition. Levels of DiI-AcLDL uptake measured by relative fluorescence per cell, were quantitated for males of 74 strains. Strains are arranged in decreasing rank order by strain-average DiI fluorescence. (B). Association mapping identified loci on Chromosomes 6 and 7 for DiI-AcLDL uptake. The horizontal red line indicates the HMDP cutoff for genome-wide significance; p = 4.2 X 10⁻⁶. [12] (C). X-axis is genomic position and Y-axis is −log10 of the p-value following correction for population structure, as described in Methods. Correlation of atherosclerosis in females (D) and males (E) with in-vitro lipid uptake in macrophages. Individual points indicate strain averages for atherosclerotic lesion area (μm2/section) and DiI-AcLDL uptake (relative fluorescence).
Fig 8
Fig 8. Lesion morphology in 5 progenitor inbred strains.
CD68+ cells but not smooth muscle actin cells differ among strains comprising the HMDP. Representative results from immunostained lesions for sm-α actin are shown in Panels A-E and CD68 in panels. C57BL/6J (A,F), A/J (B,G), BALB/cJ (C, H), C3H/HeJ (D, I), DBA/2J (E, J). (K, L) Impact of genetic background on lesion morphology in C57BL/6, A/J, C3H/HeJ, BALB/c and DBA/2, 5 progenitor strains for the HMDP recombinant inbred strains. Immunohistological staining for macrophages (CD68) (K) or smooth muscle cells (smooth muscle α-actin) (L) was measured as percent of total atherosclerotic lesion area ± SEM.
Fig 9
Fig 9. Relationships of plasma polar metabolite concentrations with atherosclerosis in Ath-HMDP.
Correlations of atherosclerosis with plasma concentrations of choline (r = -0.285, p = 0.00645) (A), butyryl-carnitine (r = -0.281, p = 0.0309) (B), TMAO (r = 0.289, p = 0.00578) (C), arginine (r = 0.316, p = 0.0146) (D), citrulline (r = 0.304, p = 0.0192) (E), and ornithine (r = -0.402, p = 0.0016) (F). Individual points indicate strain averages for atherosclerotic lesion areas (μm2/section) and metabolite concentrations (μM).
Fig 10
Fig 10. Network analysis of hepatic and aortic gene expression.
Gene coexpression networks were generated using Weighted Gene Coexpression Network Analysis (WGCNA) applied to aorta and liver gene expression profiles. The networks were partitioned into modules based on their topological overlap and the correlation of each module with lesion size was determined by calculating the average significance for all genes in the module. ((A) aorta and (C) liver). The most significantly correlated module were darkorange2 (B) for aorta and orange (D) for The most connected gene for each module (“hub gene”, shown in pink) was Wdr73 for aorta and Mx1 for liver.
Fig 11
Fig 11. Overview of the systems genetic resource.
The database comprises mouse genomic, transcriptomic, metabolomic, proteomic, and clinical trait data from the HMDP as well as selected traditional mouse crosses and several human studies. A hierarchical model of the data and its relationships (A). Novel Candidate genes identified in human studies, such as Pvrl2, can be interrogated using a variety of data including gene expression in the Aorta (B) and liver (C) as well as metabolomics and phenotypic traits.

References

    1. Go AS, Mozaffarian D, Roger VL, Benjamin EJ, Berry JD, Borden WB, et al. Heart disease and stroke statistics—2013 update: a report from the American Heart Association. Circulation. 2013;127(1):e6–e245. Epub 2012/12/15. 10.1161/CIR.0b013e31828124ad - DOI - PMC - PubMed
    1. Kathiresan S, Srivastava D. Genetics of human cardiovascular disease. Cell. 2012;148(6):1242–57. Epub 2012/03/20. 10.1016/j.cell.2012.03.001 - DOI - PMC - PubMed
    1. Lusis AJ. Genetics of atherosclerosis. Trends Genet. 2012;28(6):267–75. Epub 2012/04/07. 10.1016/j.tig.2012.03.001 - DOI - PMC - PubMed
    1. Stylianou IM, Bauer RC, Reilly MP, Rader DJ. Genetic basis of atherosclerosis: insights from mice and humans. Circ Res. 2012;110(2):337–55. Epub 2012/01/24. 10.1161/CIRCRESAHA.110.230854 - DOI - PMC - PubMed
    1. Deloukas P, Kanoni S, Willenborg C, Farrall M, Assimes TL, Thompson JR, et al. Large-scale association analysis identifies new risk loci for coronary artery disease. Nat Genet. 2013;45(1):25–33. Epub 2012/12/04. 10.1038/ng.2480 - DOI - PMC - PubMed

Publication types

Associated data