Observational Study
. 2016 May;279(2):620-9.
doi: 10.1148/radiol.2015150385. Epub 2015 Dec 22.

Arteriovenous Fistula Development in the First 6 Weeks after Creation

Collaborators, Affiliations
Observational Study

Arteriovenous Fistula Development in the First 6 Weeks after Creation

Michelle L Robbin et al. Radiology. 2016 May.

Abstract

Purpose: To assess the anatomic development of native arteriovenous fistula (AVF) during the first 6 weeks after creation by using ultrasonographic (US) measurements in a multicenter hemodialysis fistula maturation study.

Materials and methods: Each institutional review board approved the prospective study protocol, and written informed consent was obtained. Six hundred and two participants (180 women and 422 men, 459 with upper-arm AVF and 143 with forearm AVF) from seven clinical centers underwent preoperative artery and vein US mapping. AVF draining vein diameter and blood flow rate were assessed postoperatively after 1 day, 2 weeks, and 6 weeks. Relationships among US measurements were summarized after using multiple imputation for missing measurements.

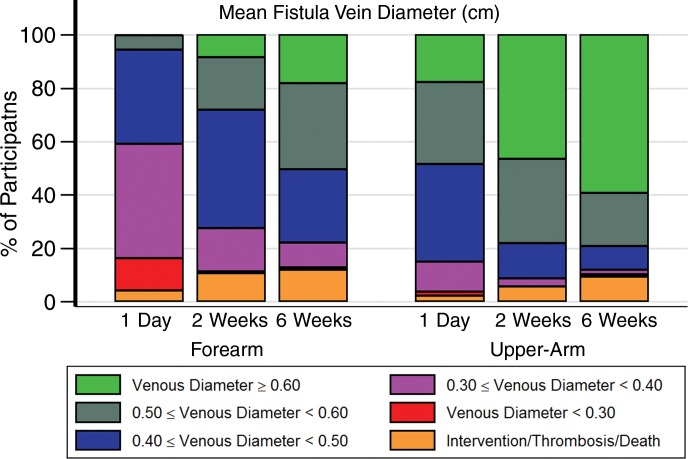
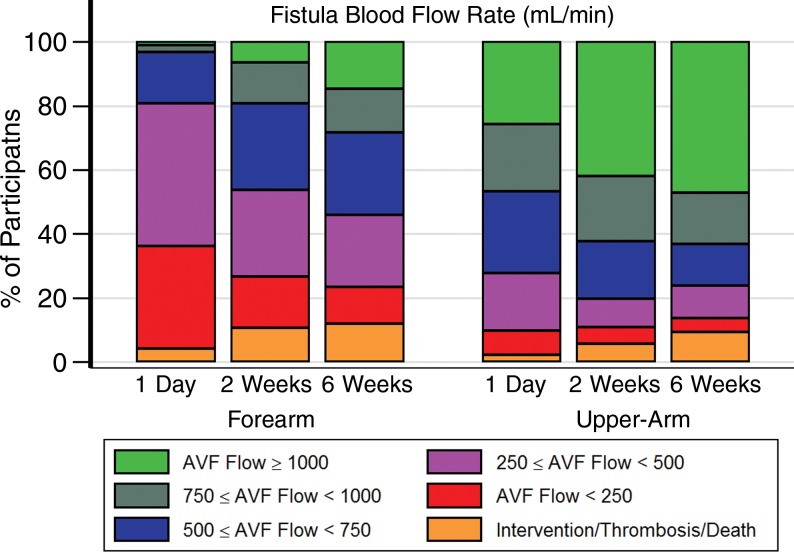
Results: In 55% of forearm AVFs (68 of 124) and 83% of upper-arm AVFs (341 of 411) in surviving patients without thrombosis or AVF intervention prior to 6 weeks, at least 50% of their 6-week blood flow rate measurement was achieved at 1 day. Among surviving patients without thrombosis or AVF intervention prior to week 2, 70% with upper-arm AVFs (302 of 433) and 77% with forearm AVFs (99 of 128) maintained at least 85% of their week 2 flow rate at week 6. Mean AVF diameters of at least 0.40 cm were seen in 85% (389 of 459), 91% (419 of 459), and 87% (401 of 459) of upper-arm AVFs and in 40% (58 of 143), 73% (104 of 143), and 77% (110 of 143) of forearm AVFs at 1 day, 2 weeks, and 6 weeks, respectively. One-day and 2-week AVF flow rates and diameters were used to predict 6-week levels, with 2-week prediction of 6-week measures more accurate than those of 1 day (flow rates, R(2) = 0.47 and 0.61, respectively; diameters, R(2) = 0.49 and 0.82, respectively).

Conclusion: AVF blood flow rate at 1 day is usually more than 50% of the 6-week blood flow rate. Two-week measurements are more predictive of 6-week diameter and blood flow than those of 1 day. US measurements at 2 weeks may be of value in the early identification of fistulas that are unlikely to develop optimally.


Figures

Figure 1a:
Figure 1a:
Box plots of AVF trends over time. (a) The mean AVF inner vein diameter was averaged over the length of the vein from the preoperative to 6-week postoperative time points. The plots indicate the mean and the 10th, 25th, 50th, 75th, and 90th percentiles of the mean fistula vein diameter. The blue boxes represent forearm fistulas, and the orange boxes represent upper-arm fistulas. Multiple imputation was used to impute missing values prior to AVF intervention, thrombosis, or death. (b) The AVF blood flow rate is shown for the 1-day to 6-week postoperative time points. The plots indicate the mean and the 10th, 25th, 50th, 75th, and 90th percentiles of the fistula flow. The blue boxes represent forearm fistulas, and the orange boxes represent upper-arm fistulas. Multiple imputation was used to impute missing values prior to AVF intervention, thrombosis, or death.
Figure 1b:
Figure 1b:
Box plots of AVF trends over time. (a) The mean AVF inner vein diameter was averaged over the length of the vein from the preoperative to 6-week postoperative time points. The plots indicate the mean and the 10th, 25th, 50th, 75th, and 90th percentiles of the mean fistula vein diameter. The blue boxes represent forearm fistulas, and the orange boxes represent upper-arm fistulas. Multiple imputation was used to impute missing values prior to AVF intervention, thrombosis, or death. (b) The AVF blood flow rate is shown for the 1-day to 6-week postoperative time points. The plots indicate the mean and the 10th, 25th, 50th, 75th, and 90th percentiles of the fistula flow. The blue boxes represent forearm fistulas, and the orange boxes represent upper-arm fistulas. Multiple imputation was used to impute missing values prior to AVF intervention, thrombosis, or death.
Figure 2a:
Figure 2a:
Graphs show percentages of AVFs categorized as having designated anatomic states at postoperative visits at 1 day, 2 weeks, and 6 weeks. Indicated are percentages of patients with upper-arm (right) or forearm (left) AVFs categorized as having designated states defined by death, AVF thrombosis, or AVF intervention (orange shading) or who remained alive without thrombosis or intervention with (a) mean AVF draining vein internal diameter (in centimeters) or (b) AVF blood flow rate (in milliliters per minute) within the designated ranges. Multiple imputation was used to impute missing flow or diameter measurements that occurred prior to death, thrombosis, or AVF intervention.
Figure 2b:
Figure 2b:
Graphs show percentages of AVFs categorized as having designated anatomic states at postoperative visits at 1 day, 2 weeks, and 6 weeks. Indicated are percentages of patients with upper-arm (right) or forearm (left) AVFs categorized as having designated states defined by death, AVF thrombosis, or AVF intervention (orange shading) or who remained alive without thrombosis or intervention with (a) mean AVF draining vein internal diameter (in centimeters) or (b) AVF blood flow rate (in milliliters per minute) within the designated ranges. Multiple imputation was used to impute missing flow or diameter measurements that occurred prior to death, thrombosis, or AVF intervention.
Figure 3a:
Figure 3a:
Graphs show the estimated proportions of participants who met anatomic maturation criteria on the basis of 1-day and 2-week AVF flow and vein diameter. Shown are the predicted probabilities that the (a) KDOQI and (b) UAB criteria will be reached at 6 weeks for different levels of either 1-day (dashed curves) or 2-week (solid curves) mean vein diameter (horizontal axis) and AVF blood flow with the black, blue, and red curves representing AVF blood flows of 250, 500, and 1000 mL/min, respectively. The curves were fit by using logistic regression with cubic splines for both AVF flow and vein diameters. The different ranges in mean vein diameter in the predicted probability curves for different AVF flows reflect the positive association of AVF flow and mean vein diameter, with higher vein diameter ranges for higher AVF flows. Fistula location was not a significant predictor of meeting the anatomic maturation criteria after accounting for the 1-day or 2-week AVF flows and was thus not included in the models.
Figure 3b:
Figure 3b:
Graphs show the estimated proportions of participants who met anatomic maturation criteria on the basis of 1-day and 2-week AVF flow and vein diameter. Shown are the predicted probabilities that the (a) KDOQI and (b) UAB criteria will be reached at 6 weeks for different levels of either 1-day (dashed curves) or 2-week (solid curves) mean vein diameter (horizontal axis) and AVF blood flow with the black, blue, and red curves representing AVF blood flows of 250, 500, and 1000 mL/min, respectively. The curves were fit by using logistic regression with cubic splines for both AVF flow and vein diameters. The different ranges in mean vein diameter in the predicted probability curves for different AVF flows reflect the positive association of AVF flow and mean vein diameter, with higher vein diameter ranges for higher AVF flows. Fistula location was not a significant predictor of meeting the anatomic maturation criteria after accounting for the 1-day or 2-week AVF flows and was thus not included in the models.

References

    1. Wong V, Ward R, Taylor J, Selvakumar S, How TV, Bakran A. Factors associated with early failure of arteriovenous fistulae for haemodialysis access. Eur J Vasc Endovasc Surg 1996;12(2):207–213. - PubMed
    1. Mahmutyazicioğlu K, Kesenci M, Fitöz S, Büyükberber S, Sencan O, Erden I. Hemodynamic changes in the early phase of artificially created arteriovenous fistula: color Doppler ultrasonographic findings. J Ultrasound Med 1997;16(12):813–817. - PubMed
    1. Malovrh M. Non-invasive evaluation of vessels by duplex sonography prior to construction of arteriovenous fistulas for haemodialysis. Nephrol Dial Transplant 1998;13(1):125–129. - PubMed
    1. Lomonte C, Casucci F, Antonelli M, et al. . Is there a place for duplex screening of the brachial artery in the maturation of arteriovenous fistulas? Semin Dial 2005;18(3):243–246. - PubMed
    1. Allon M, Robbin ML. Increasing arteriovenous fistulas in hemodialysis patients: problems and solutions. Kidney Int 2002;62(4):1109–1124. - PubMed

Publication types

LinkOut - more resources