

Comparison of Clinical and Automated Breast Density Measurements: Implications for Risk Prediction and Supplemental Screening
- PMID: 26694052
- PMCID: PMC4886704
- DOI: 10.1148/radiol.2015151261
Comparison of Clinical and Automated Breast Density Measurements: Implications for Risk Prediction and Supplemental Screening
Abstract
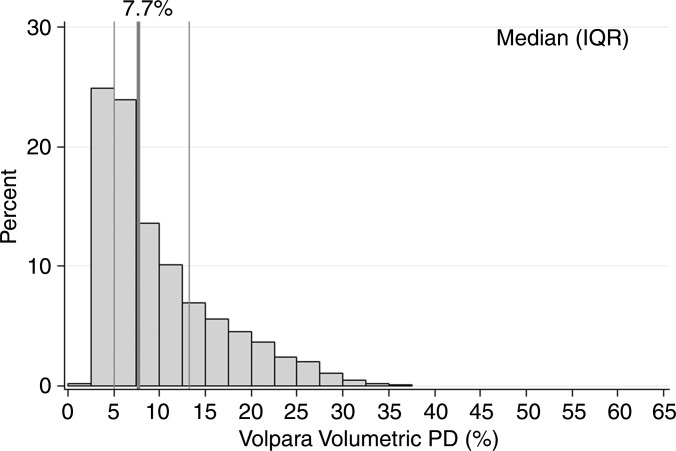
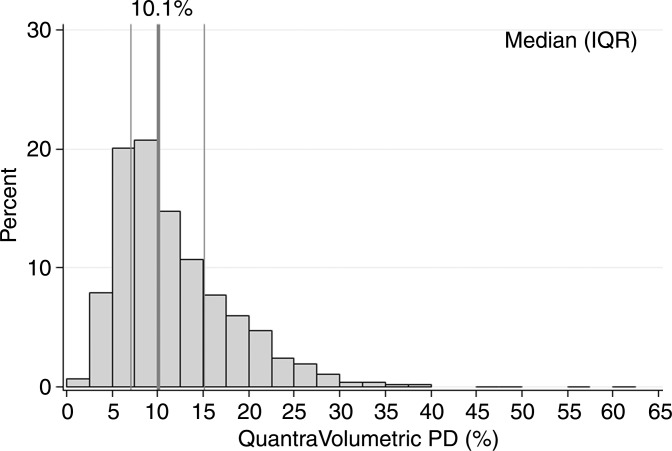
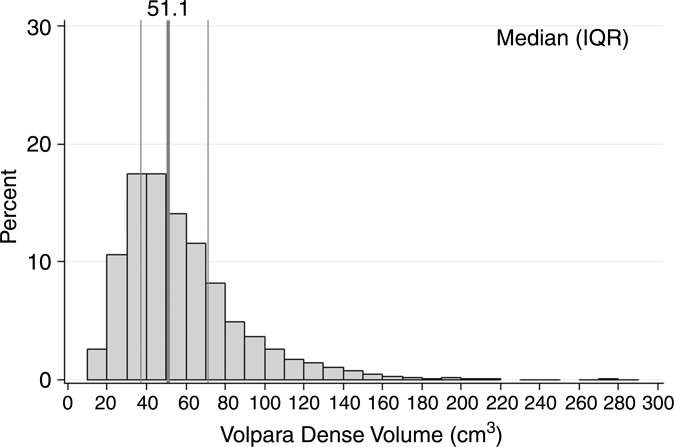
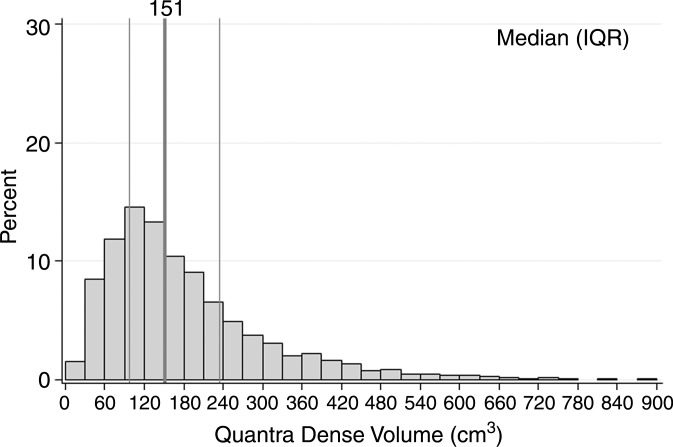
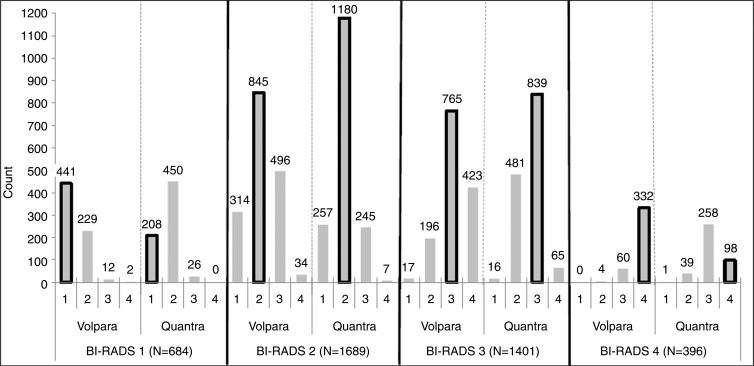
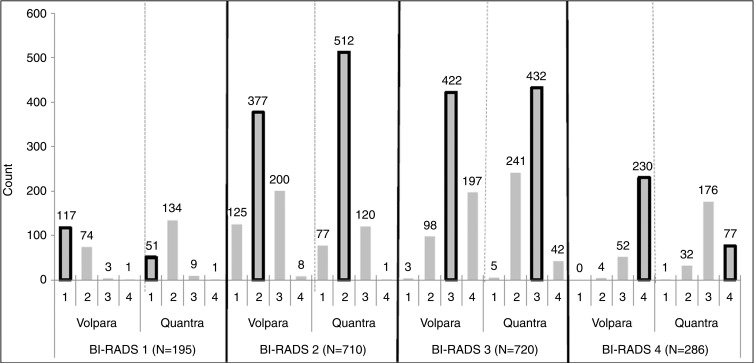
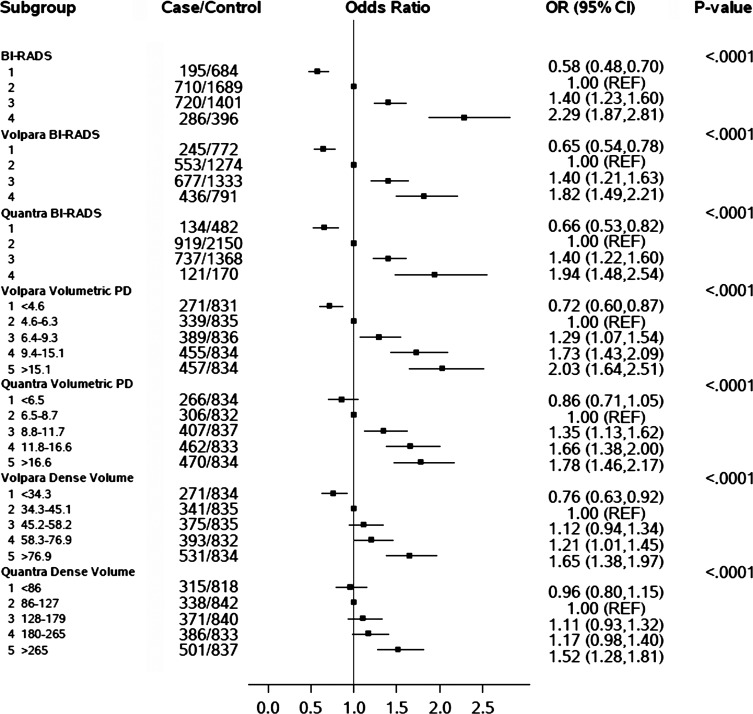
Purpose To compare the classification of breast density with two automated methods, Volpara (version 1.5.0; Matakina Technology, Wellington, New Zealand) and Quantra (version 2.0; Hologic, Bedford, Mass), with clinical Breast Imaging Reporting and Data System (BI-RADS) density classifications and to examine associations of these measures with breast cancer risk. Materials and Methods In this study, 1911 patients with breast cancer and 4170 control subjects matched for age, race, examination date, and mammography machine were evaluated. Participants underwent mammography at Mayo Clinic or one of four sites within the San Francisco Mammography Registry between 2006 and 2012 and provided informed consent or a waiver for research, in compliance with HIPAA regulations and institutional review board approval. Digital mammograms were retrieved a mean of 2.1 years (range, 6 months to 6 years) before cancer diagnosis, with the corresponding clinical BI-RADS density classifications, and Volpara and Quantra density estimates were generated. Agreement was assessed with weighted κ statistics among control subjects. Breast cancer associations were evaluated with conditional logistic regression, adjusted for age and body mass index. Odds ratios, C statistics, and 95% confidence intervals (CIs) were estimated. Results Agreement between clinical BI-RADS density classifications and Volpara and Quantra BI-RADS estimates was moderate, with κ values of 0.57 (95% CI: 0.55, 0.59) and 0.46 (95% CI: 0.44, 0.47), respectively. Differences of up to 14% in dense tissue classification were found, with Volpara classifying 51% of women as having dense breasts, Quantra classifying 37%, and clinical BI-RADS assessment used to classify 43%. Clinical and automated measures showed similar breast cancer associations; odds ratios for extremely dense breasts versus scattered fibroglandular densities were 1.8 (95% CI: 1.5, 2.2), 1.9 (95% CI: 1.5, 2.5), and 2.3 (95% CI: 1.9, 2.8) for Volpara, Quantra, and BI-RADS classifications, respectively. Clinical BI-RADS assessment showed better discrimination of case status (C = 0.60; 95% CI: 0.58, 0.61) than did Volpara (C = 0.58; 95% CI: 0.56, 0.59) and Quantra (C = 0.56; 95% CI: 0.54, 0.58) BI-RADS classifications. Conclusion Automated and clinical assessments of breast density are similarly associated with breast cancer risk but differ up to 14% in the classification of women with dense breasts. This could have substantial effects on clinical practice patterns. (©) RSNA, 2015 Online supplemental material is available for this article.
Figures
References
-
- Vachon CM, Pankratz VS, Scott CG, et al. . Longitudinal trends in mammographic percent density and breast cancer risk. Cancer Epidemiol Biomarkers Prev 2007;16(5):921–928. - PubMed
-
- Boyd NF, Guo H, Martin LJ, et al. . Mammographic density and the risk and detection of breast cancer. N Engl J Med 2007;356(3):227–236. - PubMed
-
- American College of Radiology . The American College of Radiology Breast Imaging Reporting and Data System (BI-RADS). 4th ed. Reston, Va: American College of Radiology, 2003.
Publication types
MeSH terms
Grants and funding
LinkOut - more resources
Full Text Sources
Other Literature Sources
Medical
