. 2016 Apr;46(4):846-56.
doi: 10.1002/eji.201545995. Epub 2016 Jan 18.

Dynamic spatio-temporal contribution of single β5t+ cortical epithelial precursors to the thymus medulla

Affiliations

Dynamic spatio-temporal contribution of single β5t+ cortical epithelial precursors to the thymus medulla

Carlos E Mayer et al. Eur J Immunol. 2016 Apr.

Abstract

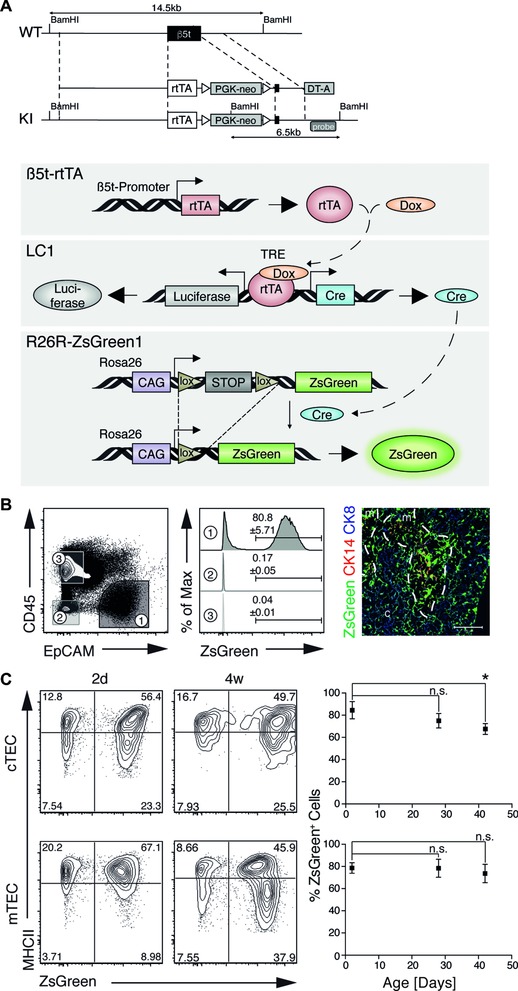
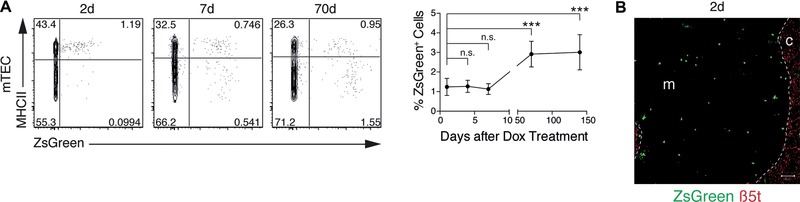
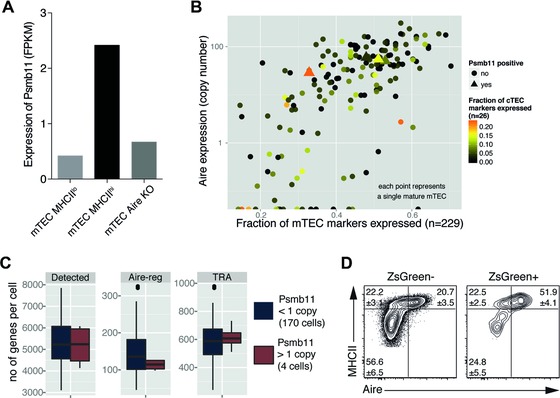
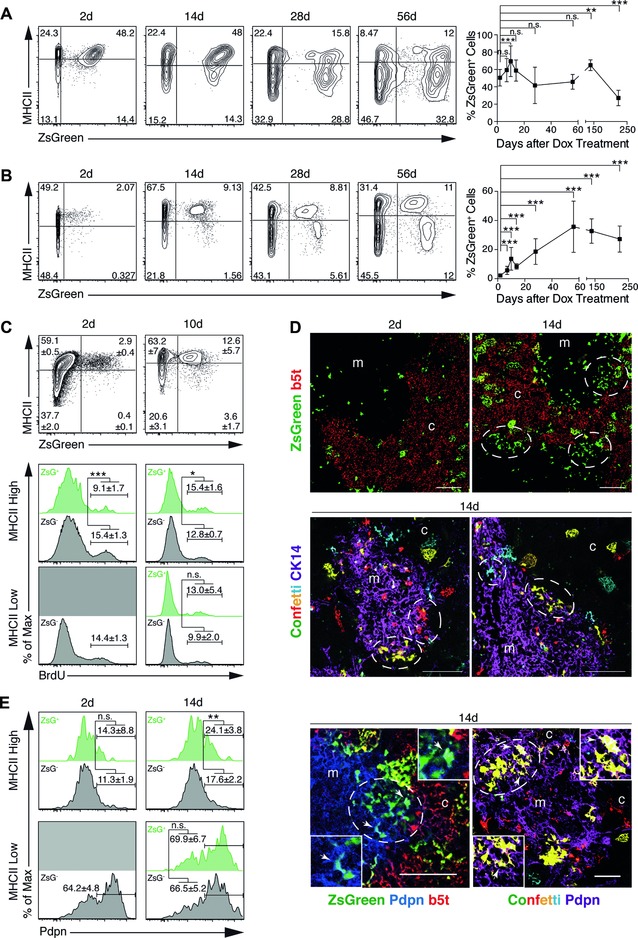
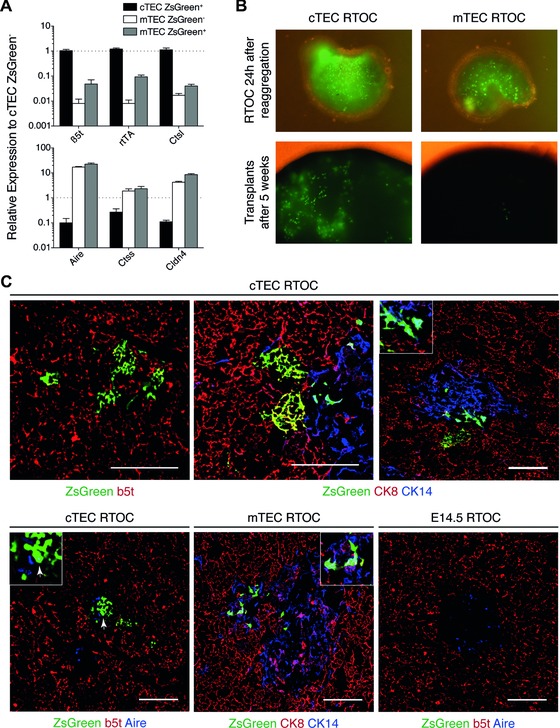
Intrathymic T-cell development is critically dependent on cortical and medullary thymic epithelial cells (TECs). Both epithelial subsets originate during early thymus organogenesis from progenitor cells that express the thymoproteasome subunit β5t, a typical feature of cortical TECs. Using in vivo lineage fate mapping, we demonstrate in mice that β5t(+) TEC progenitors give rise to the medullary TEC compartment early in life but significantly limit their contribution once the medulla has completely formed. Lineage-tracing studies at single cell resolution demonstrate for young mice that the postnatal medulla is expanded from individual β5t(+) cortical progenitors located at the cortico-medullary junction. These results therefore not only define a developmental window during which the expansion of medulla is efficiently enabled by progenitors resident in the thymic cortex, but also reveal the spatio-temporal dynamics that control the growth of the thymic medulla.

Keywords: Development; Epithelial cell; Medulla; Thymic progenitor cell; β5t.


Figures

Figure 1
Figure 1
Tissue and time controlled expression of the reporter ZsGreen in thymic epithelial cells. (A) Description of the targeting strategy to achieve rtTA expression under the transcriptional control of the β5t locus and a cartoon depicting the design of β5t promoter‐driven, TEC‐specific labeling in the triple transgenic mice, designated 3xtgβ5t. (B, C) Flow cytometric and immunofluorescent analyses of thymic tissue isolated from mice treated with Dox from embryonic day (E) 7.5 until birth. (B) The flow cytometric analyses of epithelial (EpCAM+CD45), haematopoietic (EpCAMCD45+), and nonepithelial stromal (EpCAMCD45) cells 2 days after treatment are shown. The ZsGreen expression is shown in the middle panels for each of the separate cell populations identified in the left panel. The right panel demonstrates immunofluorescence analysis of ZsGreen expression in combination with CK8 (blue) and CK14 (red). The data shown are representative of two independent experiments. (C) Flow cytometric analysis of cTECs (EpCAM+Ly51+UEA1CD45) and mTECs (EpCAM+Ly51UEA1+CD45) for expression of MHCII and ZsGreen 2 days and 4 weeks after treatment (left panels). Frequencies of ZsGreen positive cTECs and mTECs detected at indicated days after Dox treatment are displayed in the right panel (mean ± SD). The data shown are representative of 2–4 independent experiments with at least three mice per time point each. Statistical significance determined by unpaired two‐tailed Student's t‐test. *p < 0.05.
Figure 2
Figure 2
Lineage tracing of medullary thymic epithelial cells in adult mice. (A) Frequency and time course analyses of ZsGreen expression in mTECs of treated 3xtgβ5t mice. Five‐week‐old 3xtgβ5t mice were i.p. injected twice within 24 h with Dox (2 mg) and given Dox (2 mg/mL) supplemented drinking water in that time. The frequency of labeled mTECs was measured at the indicated time points. Flow cytometric analyses of mTECs (EpCAM+Ly51UEA1+CD45) for expression of MHCII and ZsGreen (left); relative frequency of ZsGreen+ mTECs over the course of 140 days (right, mean ± SD, n = 3 mice per time point, from a single experiment representative of two independent experiments per time point). Statistical significance determined by unpaired two‐tailed Student's t‐test. *p < 0.05, **p < 0.01, ***p < 0.001. (B) Immunofluorescent analysis of the thymic tissue at 2 days after Dox treatment of 5‐week‐old 3xtgβ5t mice. Tissue sections were stained with anti‐β5t antibodies (red) and analyzed for the expression of ZsGreen (green). c: cortex; m: medulla. Dashed line demarcate cortico‐medullary junction. Scale bar 50 μm.
Figure 3
Figure 3
Promiscuous gene expression contributes to ZsGreen expression in medullary MHCIIhi thymic epithelial cells in adult 3xtgβ5t mice. (A) Expression of β5t (Psmb11) measured by RNAseq of 4‐week‐old wild‐type MHCIIhi mTECs, MHCIIlo mTECs, and MHCIIhi Aire‐deficient mTECs. (B) Promiscuous expression of Psmb11 in single mature mTECs. Mature mTECs positive for Psmb11 (> 1 copy, triangles) express Aire and show expression of mTEC and cTEC marker genes that is similar to that observed in Psmb11 negative cells (circles). (C) Analysis of gene expression in single Aire‐expressing mTECs. No significant difference in the number of Aire‐regulated genes or TRA was detected between Psmb11 positive and negative cells (Mann–Whitney U test: Detected: p = 0.8448; Aire‐reg: 0 = 3153; TRA: p = 6369). (D) Flow cytometric analysis for the expression of MHCII and Aire in ZsGreen– and ZsGreen+ mTECs of 3xtgβ5t mice 48 h after Dox treatment. Values indicate mean ± SD percentage of gated population (n = 3 mice; representative of two independent experiments).
Figure 4
Figure 4
Lineage tracing in 1‐week‐old 3xtgβ5t mice. (A) Frequency and time course analyses of ZsGreen expression in cTECs. One‐week‐old mice received a single i.p. injection of Dox (1 mg) and were subsequently analyzed at the indicated times. Flow cytometric analyses of cTECs (EpCAM+LY51+UEA1CD45) for the expression of ZsGreen and MHCII (left panel) and relative frequencies of ZsGreen+ cTECs over the course of 250 days after treatment (right panel). (B) Frequency and time course analyses of ZsGreen expression in mTECs from mice described in (A). Flow cytometric analyses of mTECs (EpCAM+LY51UEA1+CD45) for the expression of MHCII and ZsGreen (left panel) and relative frequencies of ZsGreen+ mTECs over the course of 250 days after drug treatment (right panel). (C) BrdU incorporation analysis of mTECs (EpCAM+UEA1+CD45) in 3xtgβ5t mice treated at 1 week of age and chased for 2 and 10 days, respectively (top). The BrdU incorporation rates are displayed in lower panels for ZsGreen– (gray) and ZsGreen+ (green) mTEC subpopulations expressing high or low levels of MHCII. (D) Immunofluorescent analysis of thymic sections from 3xtgβ5t mice that had been treated with Dox at 1 week of age and analyzed 2 and 14 days after treatment for the expression of β5t (red) and ZsGreen (green) (top). Note the clusters of ZsGreen positive cells positioned at the cortico‐medullary junction (dashed circles). R26R‐confetti mice were crossed with β5t‐rtTA and LC1 generating triple transgenic mice, 3xtgconfetti [β5t‐rtTA::LC1::R26R‐confetti] (bottom). Triple transgenic mice were treated with a single dose of Dox (1 mg) at 1 week of age and analyzed 2 weeks later for the expression of the transgenic fluorochromes and cytokeratin 14 (as mTEC marker). Note monochromatic cell clusters exclusively localized to the cortico‐medullary junction. Images representative from two experiments with a total of three mice each are shown. (E) Flow cytometric analysis of Podoplanin expression in ZsGreen‐negative and ‐positive subpopulations of MHCIIhi and MHCIIlo mTECs (EpCAM+LY51UEA1+CD45) (left). One‐week old 3xtgβ5t mice were treated with a single dose of Dox (0.3 mg) and analyzed at 2 and 14 days, respectively. Immunofluorescent analysis of thymic sections from 3xtgβ5t and 3xtgconfetti mice treated at 1 week of age with a single dose of Dox (0.3 mg) and analyzed 14 days later for the expression of Podoplanin (right). Arrows indicate cells coexpressing reporter and Podoplanin in areas that are shown in the close‐up. c: cortex; m: medulla. Scale bar 100 μm. The data signify mean ± SD and are representative of 2–5 independent experiments, each performed with at least three mice per time point. Statistical significance determined by unpaired two‐tailed Student's t‐test. *p < 0.05, **p < 0.01, ***p < 0.001.
Figure 5
Figure 5
Transplantation of ZsGreen+ cTECs from 3xtgβ5t mice gives rise to cortical and medullary TECs. (A) RT‐qPCR gene expression analysis of cortical (β5t, rtTA, Ctsl) and medullary (Aire, Ctss, Cldn4) TEC markers in ZsGreen–/+ TEC subpopulations. One‐week‐old mice received a single i.p. injection of Dox (1 mg) 48 h prior to sorting cTECs (EpCAM+LY51+UEA1CD45) and mTECs (EpCAM+LY51UEA1+CD45), subdivided by the expression of ZsGreen. Gene expression was normalized to EpCAM and is presented as relative expression to cTEC ZsGreen– (mean ± SD, n = 3). (B) Representative macroscopic images of RTOC 24 h after reaggregation (top) and the transplants 5 weeks posttransplantation (bottom). (C) Immunofluorescent analysis of thymic sections from transplants made with ZsGreen+ cTECs for the expression of ZsGreen and β5t (top left), ZsGreen, CK8 and CK14 (top middle, right) or ZsGreen, β5t and Aire (bottom left), and the analysis for the expression of ZsGreen, CK8, and CK14 in thymic sections from transplants made with ZsGreen+ mTEC (bottom middle) or for ZsGreen, β5t, and Aire in transplants originally using embryonic stromal cells alone (bottom right). Arrows indicate cells coexpressing ZsGreen and mTEC marker (CK14 or Aire) in areas that are shown in the close‐up. Single images representative from of three experiments with a total of two mice each are shown. Scale bar 100 μm.

Comment in

References

    1. Anderson, G. and Takahama, Y. , Thymic epithelial cells: working class heroes for T cell development and repertoire selection. Trends Immunol. 2012. 33: 256–263. - PubMed
    1. Klein, L. , Kyewski, B. , Allen, P. M. and Hogquist, K. A. , Positive and negative selection of the T cell repertoire: what thymocytes see (and don't see). Nat. Rev. Immunol. 2014. 14: 377–391. - PMC - PubMed
    1. Cowan, J. E. , Parnell, S. M. , Nakamura, K. , Caamano, J. H. , Lane, P. J. L. , Jenkinson, E. J. , Jenkinson, W. E. et al, The thymic medulla is required for Foxp3+ regulatory but not conventional CD4+ thymocyte development. J. Exp. Med. 2013. 210: 675–681. - PMC - PubMed
    1. Metzger, T. C. and Anderson, M. S. , Control of central and peripheral tolerance by Aire. Immunol. Rev. 2011. 241: 89–103. - PMC - PubMed
    1. Daley, S. R. , Hu, D. Y. and Goodnow, C. C. , Helios marks strongly autoreactive CD4+ T cells in two major waves of thymic deletion distinguished by induction of PD‐1 or NF‐κB. J. Exp. Med. 2013. 210: 269–285. - PMC - PubMed

Publication types

Substances

LinkOut - more resources