. 2016 Mar;25(3):754-68.
doi: 10.1002/pro.2867. Epub 2016 Jan 13.

Rational design of crystal contact-free space in protein crystals for analyzing spatial distribution of motions within protein molecules

Affiliations

Rational design of crystal contact-free space in protein crystals for analyzing spatial distribution of motions within protein molecules

Rei Matsuoka et al. Protein Sci. 2016 Mar.

Abstract

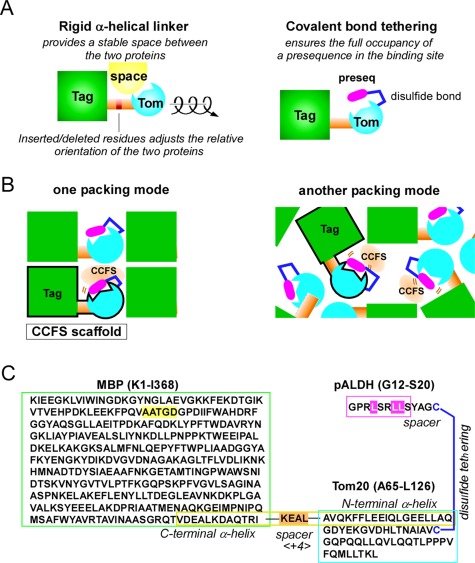
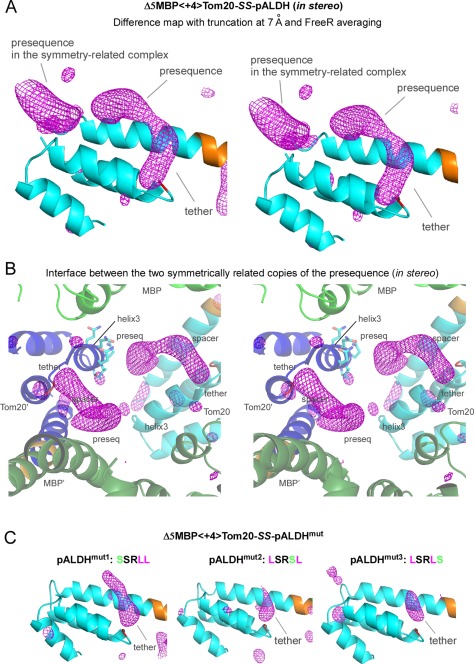
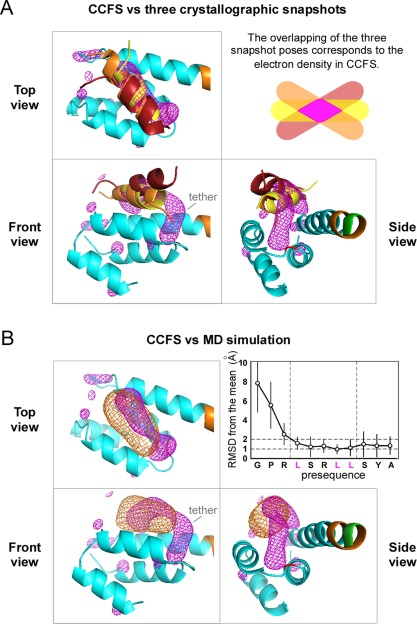
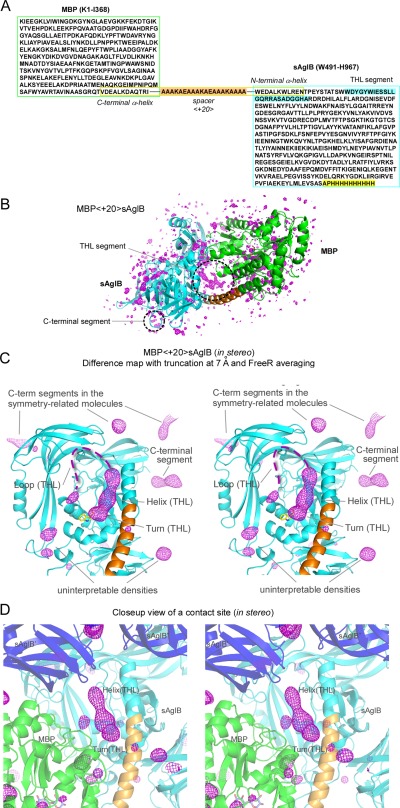
Contacts with neighboring molecules in protein crystals inevitably restrict the internal motions of intrinsically flexible proteins. The resultant clear electron densities permit model building, as crystallographic snapshot structures. Although these still images are informative, they could provide biased pictures of the protein motions. If the mobile parts are located at a site lacking direct contacts in rationally designed crystals, then the amplitude of the movements can be experimentally analyzed. We propose a fusion protein method, to create crystal contact-free space (CCFS) in protein crystals and to place the mobile parts in the CCFS. Conventional model building fails when large amplitude motions exist. In this study, the mobile parts appear as smeared electron densities in the CCFS, by suitable processing of the X-ray diffraction data. We applied the CCFS method to a highly mobile presequence peptide bound to the mitochondrial import receptor, Tom20, and a catalytically relevant flexible segment in the oligosaccharyltransferase, AglB. These two examples demonstrated the general applicability of the CCFS method to the analysis of the spatial distribution of motions within protein molecules.

Keywords: crystal contact effects; crystallographic method; fusion protein; mitochondrial presequence receptor Tom20; oligosaccharyltransferase AglB; protein motional analysis.


Figures

Figure 1
Figure 1
Key techniques to create CCFS in protein crystals. (A) Design of a fusion protein with a rigid α‐helical connection. The relative orientation of the tag and target proteins can be adjusted as a function of the number of residues inserted/deleted at the middle of the connector helix. Covalent‐bond tethering ensures the full occupancy of a weak‐affinity presequence in the binding site. (B) Concept of the CCFS scaffold. The CCFS can be intentionally created in the rigid framework formed by the “CCFS scaffold,” independent of the packing modes of the protein molecules. The CCFS scaffold (surrounded by black borders) is a fusion protein connected by a rigid linker. (C) Amino acid sequence of MBP<+4>Tom20‐SS‐pALDH. The connector helix is enclosed by the yellow box, and the 4‐residue insertion as a spacer is highlighted in orange. A disulfide bond was formed between the cysteine residue attached to the C‐terminus of the pALDH peptide and the single cysteine residue in MBP‐Tom20. The 5‐residue deletion, Δ5, in MBP and the three essential hydrophobic leucine residues in pALDH are highlighted in yellow and magenta, respectively.
Figure 2
Figure 2
Effects of the different spacer lengths in the connector helix on the structure and the formation of CCFS. (A) Structural comparison of two fusion proteins with spacer lengths of +2 and +4. A long, continuous α‐helical structure (yellow, consisting of the C‐terminal α‐helix of MBP, the spacer, and the N‐terminal α‐helix of Tom20) was formed in the two crystal structures. The Tom20 proteins are located on nearly opposite sides around the helical axis of the connector helix in the two structures, as intended. MBP and Tom20 are colored green and cyan, respectively. (B) Formation of CCFS in the crystal of MBP<+4>Tom20. One molecule in the crystal is colored, and symmetrically related molecules are monochrome.
Figure 3
Figure 3
Electron density maps of the disulfide‐bond tethered MBP‐Tom20 complexes. (A) F oF c difference electron density map of Δ5MBP<+4>Tom20‐SS‐pALDH, contoured at +3σ. (B) Anomalous difference map of Δ5MBP<+4>Tom20‐SS‐(N‐iodo)pALDH, contoured at +5σ to locate iodine atoms/ions. The inset shows an enlarged view of the electron density of the iodine atom in the 4‐iodobenzoyl group attached to the N‐terminus of pALDH. The electron densities of the bound iodine ions from the precipitant solution are also clearly visible, but their spherical shapes are easily discriminated from the iodine atom at the N‐terminus. (C) Difference map with truncation of high‐resolution reflections at 7 Å prior to Fourier transformation, contoured at +3σ. Note that the same X‐ray diffraction data set was used for map generation in (A) and (C). MBP and Tom20 are colored green and cyan, respectively. The 4‐residue spacer is colored orange. Water molecules included in the molecular replacement are depicted as blue dots.
Figure 4
Figure 4
Effects of map sharpening/blurring and truncation on the difference electron density map, contoured at +3σ. (A) Control: no sharpening or blurring was applied. (B) The observed diffraction data (F o) were scaled up using the equation, F sharpened = F o exp[‐b(sinθ/λ)2], where b is a sharpening factor, θ is the scattering angle, and λ is the X‐ray wavelength. (C) Simultaneous application of map sharpening for the low‐resolution reflections and map blurring for the high‐resolution reflections. The bell‐shaped function for scaling is F sharpened = F o exp[‐b(sinθ/λ)2c(sinθ/λ)4]. (D) Simple blurring was also effective. (E) Truncation of the high‐resolution reflections, as a simplified version of the simultaneous sharpening and blurring. MBP, Tom20, and the 4‐residue spacer are colored green, cyan, and orange, respectively.
Figure 5
Figure 5
Electron densities in the CCFS corresponding to the presequence peptide and disulfide tether in the binding site of Tom20. (A) Stereo view of the truncated and FreeR‐averaged difference map of Δ5MBP<+4>Tom20‐SS‐pALDH, contoured at +3σ. The electron densities in the binding site of Tom20 were improved by the averaging of 20 maps calculated with different free test sets, as compared with the map without FreeR averaging in Figure 3(C). Tom20 and the 4‐residue spacer are colored cyan and orange, respectively. (B) Stereo close‐up view of the interface between two symmetrically related copies of the elongated electron density. MBP and Tom20 are colored green and cyan in one molecule, and dark green and blue in another molecule, respectively. The side chains of the helix3 of one Tom20 structure are shown in a stick model. (C) Effects of the essential leucine substitutions in pALDH on the electron density in the CCFS. These difference maps were generated and drawn in exactly the same way as in (A). Only the tether parts remained visible in the CCFS.
Figure 6
Figure 6
Validation of the electron density in the CCFS of the Δ5MBP<+4>Tom20‐SS‐pALDH crystal. (A) Superimposition of the electron density in the CCFS (magenta mesh) with the three crystallographic snapshots of the pALDH presequence, depicted as brown (PDB codes 2V1S), orange (2V1T), and yellow (3AX3) ribbon models. The 44 Cα atoms (A65‐E79+Y86‐L114) of the first three α‐helices of Tom20 were superimposed. (B) Superimposition of the electron density in the CCFS (magenta mesh) with the electron density calculated from the MD simulation (orange mesh). Tom20 and the 4‐residue spacer are colored cyan and orange, respectively. The graph shows the rmsds of the Cα atoms from the mean positions during the MD simulation.
Figure 7
Figure 7
Electron density maps of the MBP‐sAglB fusion protein. (A) Amino acid sequence of MBP<+20>sAglB. The connector helix is enclosed by the yellow box, and the +20 spacer is highlighted in orange. The THL segment and the C‐terminal segment, which were not included in the CCFS scaffold, are highlighted in cyan and yellow, respectively. (B) F oF c difference map, (C) truncated and FreeR‐averaged difference map (in stereo), and (D) close‐up view of a crystal contact site (in stereo) of MBP<+20>sAglB, all contoured at +3σ. Note that the same X‐ray diffraction data set was used for map generation in (B–D). The 3‐residue turn structure of the THL segment consists of the underlined residues in the well‐conserved WWDYG motif. The first Trp residue of the WWDYG motif is part of the CCFS scaffold, and its side chain is depicted as a yellow stick model in (C). The invisible, highly mobile loop of the THL segment is shown as dashed lines. MBP, sAglB, and the 20‐residue spacer are colored green, cyan, and orange in one molecule, respectively. sAglBs in other fusion protein molecules are colored blue, and labeled with sAglB′ and sAglB″.

References

    1. Singh P, Abeysinghe T, Kohen A (2015) Linking protein motion to enzyme catalysis. Molecules 20:1192–1209. - PMC - PubMed
    1. Ramanathan A, Savol A, Burger V, Chennubhotla CS, Agarwal PK (2014) Protein conformational populations and functionally relevant substates. Acc Chem Res 47:149–156. - PubMed
    1. van den Bedem H, Fraser JS (2015) Integrative, dynamic structural biology at atomic resolution–it's about time. Nat Methods 12:307–318. - PMC - PubMed
    1. Gobl C, Madl T, Simon B, Sattler M (2014) NMR approaches for structural analysis of multidomain proteins and complexes in solution. Prog Nucl Magn Reson Spectrosc 80:26–63. - PubMed
    1. Vranken WF (2014) NMR structure validation in relation to dynamics and structure determination. Prog Nucl Magn Reson Spectrosc 82:27–38. - PubMed

Publication types

MeSH terms

Substances