. 2015 Dec 22:6:10231.
doi: 10.1038/ncomms10231.

Aerosol influence on energy balance of the middle atmosphere of Jupiter

Affiliations

Aerosol influence on energy balance of the middle atmosphere of Jupiter

Xi Zhang et al. Nat Commun. .

Abstract

Aerosols are ubiquitous in planetary atmospheres in the Solar System. However, radiative forcing on Jupiter has traditionally been attributed to solar heating and infrared cooling of gaseous constituents only, while the significance of aerosol radiative effects has been a long-standing controversy. Here we show, based on observations from the NASA spacecraft Voyager and Cassini, that gases alone cannot maintain the global energy balance in the middle atmosphere of Jupiter. Instead, a thick aerosol layer consisting of fluffy, fractal aggregate particles produced by photochemistry and auroral chemistry dominates the stratospheric radiative heating at middle and high latitudes, exceeding the local gas heating rate by a factor of 5-10. On a global average, aerosol heating is comparable to the gas contribution and aerosol cooling is more important than previously thought. We argue that fractal aggregate particles may also have a significant role in controlling the atmospheric radiative energy balance on other planets, as on Jupiter.


Figures

Figure 1
Figure 1. Globally averaged heating and cooling fluxes on Jupiter.
The heating (yellow branch) and cooling (cyan branch) fluxes are in units of W m−2. The stratosphere is shaded. The heating flux is associated with the incoming solar radiation and the cooling flux is related to the outgoing thermal radiation. Of the 13.5 W m−2 of solar radiation incident to Jupiter's atmosphere, 0.1 W m−2 is reflected back to space and 11.8 W m−2 is transmitted to the troposphere. Tropospheric hazes and clouds absorbed 7.1 W m−2 and 4.7 W m−2 is reflected back to space. The remainder of the solar energy is absorbed in the middle atmosphere by fractal haze particles (0.7 W m−2) and CH4 gas molecules (0.9 W m−2). The total outgoing thermal radiation from our radiative calculation is ∼13–14 W m−2, consistent with that from Cassini and Voyager observations. The thermal cooling flux is mainly emitted from the troposphere (12–13 W m−2). In the middle atmosphere, the net cooling flux is 1.4 W m−2 emitted by gas molecules H2, CH4, C2H2, and C2H6 (black and white molecule diagrams). The upper limit of the outgoing thermal flux from the fractal aggregates (blue diagrams) is ∼0.2 W m−2 as determined in this study.
Figure 2
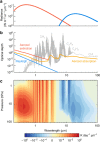
Figure 2. Spectrally resolved heating and cooling rates and corresponding energy fluxes and opacity.
(a) Globally averaged solar radiation received by Jupiter, approximated by a blackbody of 5,778 K (red) and Jupiter thermal radiation in the stratosphere approximated by a blackbody of 150 K (blue). (b) Total optical depth from the top of the atmosphere to 100 hPa as a function of wavelength at 60° S. The gas optical depth (grey) includes H2–H2 and H2–He CIA and CH4, C2H2 and C2H6 absorption. The non-gas components include Rayleigh scattering (blue), fractal aggregate aerosol extinction (red) and the aerosol absorption (orange). (c) Spectrally resolved zonally averaged solar heating (0.2–5 μm) and cooling (5–100 μm) map at 60° S. Absolute values of the heating/cooling rates that are <10−6 K per day per μm are not shown. Solar heating dominates shortwards of 5 μm while Jupiter thermal cooling (shown in negative values here) dominates longwards of 5 μm. Contributions from the H2–H2 and H2–He CIA and gas vibrational–rotational bands are shown. Aerosol heating is important in the ultraviolet and visible regions and aerosol cooling is important in the mid-infrared region beyond 11 μm.
Figure 3
Figure 3. Vertical heating rate profiles.
(a) Zonally averaged heating rates at 60° S; (b) Globally averaged heating rates. The gas-only calculations are shown in black. The dashed black lines show the possible gas heating rates due to the uncertainty of CH4 profiles. The coloured lines represent different aerosol retrieval solutions. Cases H1–H5 correspond to the green, red, purple, blue and orange curves, respectively. See Table 1 for detailed input information of the cases.
Figure 4
Figure 4. Radiative balance calculation results in the middle atmosphere of Jupiter based on Cassini flyby observations.
(a) Net radiative heating rate map (in units of K per Earth day) without aerosols; (b) net radiative heating rate map with aerosol heating; (c) net radiative heating rate map with aerosol heating and cooling; (d) globally averaged heating (yellow with pink shading) and cooling (cyan with blue shading) profiles without aerosols; (e) globally averaged heating and cooling profiles with aerosol heating; and (f) globally averaged heating and cooling profiles with aerosol heating and cooling. The uncertainty ranges are shaded.
Figure 5
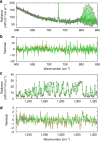
Figure 5. Spectral inversion results at 57° S.
(a) Spectra at 600–850 cm−1 region (H2–H2 and H2–He CIA, C2H2 and C2H6 bands); (b) fitting residual at 600–850 cm−1 region; (c) spectra at 1,225–1,325 cm−1 region (CH4 bands); (d) fitting residual at 1,225–1,325 cm−1 region. CIRS observations are shown as black circles. The red, blue, orange, green and brown colours represent NEMESIS retrieval cases C1–C5, respectively. The goodness of fit (χ2/N where N is the number of measurements) in the 600–850 cm−1 region is ∼0.5–0.6 for each case. In the CH4 band, the goodness of fit is around unity for each case except for the brown case (χ2/N=1.96), which does not fit the CIRS spectra. See Table 2 for detailed information of the cases.
Figure 6
Figure 6. Vertical temperature and cooling rate profiles at 57° S.
(a) Retrieved temperature profiles; (b) corresponding zonally averaged cooling rates. The red, blue, orange and green colours represent cases C1–C4, respectively. The C5 case is not used because it cannot explain the CIRS observations.
Figure 7
Figure 7. Refractive indices of aerosols from 0.2 to 100 μm.
(a) Real part of the refractive index; (b) imaginary part. The blue one is from the Titan tholin experiment; orange is from Titan CIRS observations; green is same as the blue one but reduced by a factor of 2 (case C4); black is the Jupiter-analogue aerosol experiment; red is the derived from Cassini ISS observations, with an interpolation in the coordinate of linear wavelength and logarithmic k value. The red dashed line is used in the nominal case for the heating rate calculation (case H1) in this study.

References

    1. Moses J. I. et al.. in Jupiter-The Planet, Satellites and Magnetosphere eds Bagenal F., Dowling T., McKinnon W. 129–157Cambridge University Press (2004).
    1. Hanel R., Conrath B., Herath L., Kunde V. & Pirraglia J. Albedo, internal heat, and energy balance of Jupiter: Preliminary results of the Voyager infrared investigation. J. Geophys. Res. 86, 8705–8712 (1981).
    1. Yelle R. V., Griffith C. A. & Young L. A. Structure of the Jovian stratosphere at the Galileo probe entry site. Icarus 152, 331–346 (2001).
    1. Zhang X. et al.. Radiative forcing of the stratosphere of Jupiter, part I: atmospheric cooling rates from Voyager to Cassini. Planet. Space Sci. 88, 3–25 (2013).
    1. Conrath B. J., Gierasch P. J. & Leroy S. S. Temperature and circulation in the stratosphere of the outer planets. Icarus 83, 255–281 (1990).

Publication types

LinkOut - more resources