Analysis of functional importance of binding sites in the Drosophila gap gene network model
- PMID: 26694511
- PMCID: PMC4686791
- DOI: 10.1186/1471-2164-16-S13-S7
Analysis of functional importance of binding sites in the Drosophila gap gene network model
Abstract
Background: The statistical thermodynamics based approach provides a promising framework for construction of the genotype-phenotype map in many biological systems. Among important aspects of a good model connecting the DNA sequence information with that of a molecular phenotype (gene expression) is the selection of regulatory interactions and relevant transcription factor bindings sites. As the model may predict different levels of the functional importance of specific binding sites in different genomic and regulatory contexts, it is essential to formulate and study such models under different modeling assumptions.
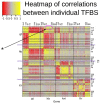
Results: We elaborate a two-layer model for the Drosophila gap gene network and include in the model a combined set of transcription factor binding sites and concentration dependent regulatory interaction between gap genes hunchback and Kruppel. We show that the new variants of the model are more consistent in terms of gene expression predictions for various genetic constructs in comparison to previous work. We quantify the functional importance of binding sites by calculating their impact on gene expression in the model and calculate how these impacts correlate across all sites under different modeling assumptions.
Conclusions: The assumption about the dual interaction between hb and Kr leads to the most consistent modeling results, but, on the other hand, may obscure existence of indirect interactions between binding sites in regulatory regions of distinct genes. The analysis confirms the previously formulated regulation concept of many weak binding sites working in concert. The model predicts a more or less uniform distribution of functionally important binding sites over the sets of experimentally characterized regulatory modules and other open chromatin domains.
Figures


Similar articles
-
Sequence-based model of gap gene regulatory network.BMC Genomics. 2014;15 Suppl 12(Suppl 12):S6. doi: 10.1186/1471-2164-15-S12-S6. Epub 2014 Dec 19. BMC Genomics. 2014. PMID: 25564104 Free PMC article.
-
Spatial bistability generates hunchback expression sharpness in the Drosophila embryo.PLoS Comput Biol. 2008 Sep 26;4(9):e1000184. doi: 10.1371/journal.pcbi.1000184. PLoS Comput Biol. 2008. PMID: 18818726 Free PMC article.
-
Quantitative analysis of the Drosophila segmentation regulatory network using pattern generating potentials.PLoS Biol. 2010 Aug 17;8(8):e1000456. doi: 10.1371/journal.pbio.1000456. PLoS Biol. 2010. PMID: 20808951 Free PMC article.
-
Sequential construction of a model for modular gene expression control, applied to spatial patterning of the Drosophila gene hunchback.J Bioinform Comput Biol. 2016 Apr;14(2):1641005. doi: 10.1142/S0219720016410055. J Bioinform Comput Biol. 2016. PMID: 27122317
-
Challenges for modeling global gene regulatory networks during development: insights from Drosophila.Dev Biol. 2010 Apr 15;340(2):161-9. doi: 10.1016/j.ydbio.2009.10.032. Epub 2009 Oct 27. Dev Biol. 2010. PMID: 19874814 Review.
Cited by
-
Tcf12 and NeuroD1 cooperatively drive neuronal migration during cortical development.Development. 2022 Feb 1;149(3):dev200250. doi: 10.1242/dev.200250. Epub 2022 Feb 11. Development. 2022. PMID: 35147187 Free PMC article.
-
Impact of Negative Feedbacks on De Novo Pyrimidines Biosynthesis in Escherichia coli.Int J Mol Sci. 2023 Mar 2;24(5):4806. doi: 10.3390/ijms24054806. Int J Mol Sci. 2023. PMID: 36902235 Free PMC article.
-
In silico evolution of the Drosophila gap gene regulatory sequence under elevated mutational pressure.BMC Evol Biol. 2017 Feb 7;17(Suppl 1):4. doi: 10.1186/s12862-016-0866-y. BMC Evol Biol. 2017. PMID: 28251865 Free PMC article.
-
System drift and speciation.Evolution. 2022 Feb;76(2):236-251. doi: 10.1111/evo.14356. Epub 2021 Oct 7. Evolution. 2022. PMID: 34529267 Free PMC article.
-
Analysis of Genomic Sequence Motifs for Deciphering Transcription Factor Binding and Transcriptional Regulation in Eukaryotic Cells.Front Genet. 2016 Feb 23;7:24. doi: 10.3389/fgene.2016.00024. eCollection 2016. Front Genet. 2016. PMID: 26941778 Free PMC article. Review.
References
-
- Duque T, Hassan Samee MA, Kazemian M, Pham HN, Brodsky MH, Sinha S. Simulations of enhancer evolution provide mechanistic insights into gene regulation. Molecular Biology and Evolution. 2013. http://mbe.oxfordjournals.org/content/early/2013/10/04/molbev.mst170.ful.... http://mbe.oxfordjournals.org/content/early/2013/10/04/molbev.mst170.ful... doi:10.1093/molbev/mst170. - PMC - PubMed
Publication types
MeSH terms
Substances
LinkOut - more resources
Full Text Sources
Molecular Biology Databases
Research Materials
Miscellaneous

