Meta-Analysis
. 2015 Dec 22:16:287.
doi: 10.1186/s13059-015-0853-4.

Meta-analysis of RNA-seq expression data across species, tissues and studies

Affiliations
Meta-Analysis

Meta-analysis of RNA-seq expression data across species, tissues and studies

Peter H Sudmant et al. Genome Biol. .

Abstract

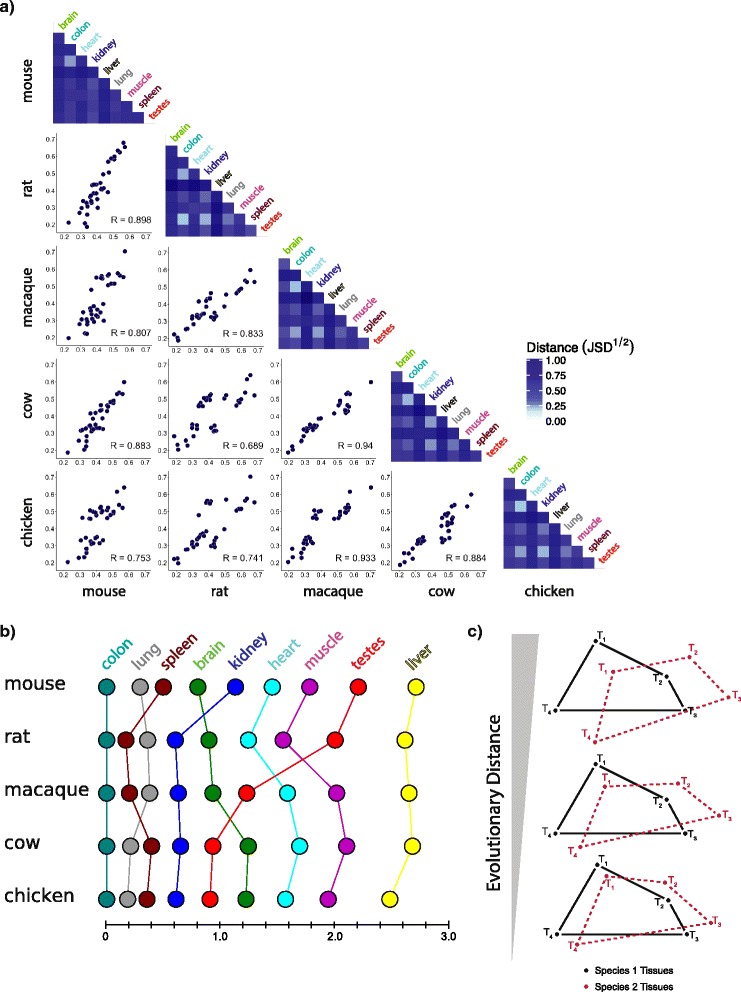
Background: Differences in gene expression drive phenotypic differences between species, yet major organs and tissues generally have conserved gene expression programs. Several comparative transcriptomic studies have observed greater similarity in gene expression between homologous tissues from different vertebrate species than between diverse tissues of the same species. However, a recent study by Lin and colleagues reached the opposite conclusion. These studies differed in the species and tissues analyzed, and in technical details of library preparation, sequencing, read mapping, normalization, gene sets, and clustering methods.

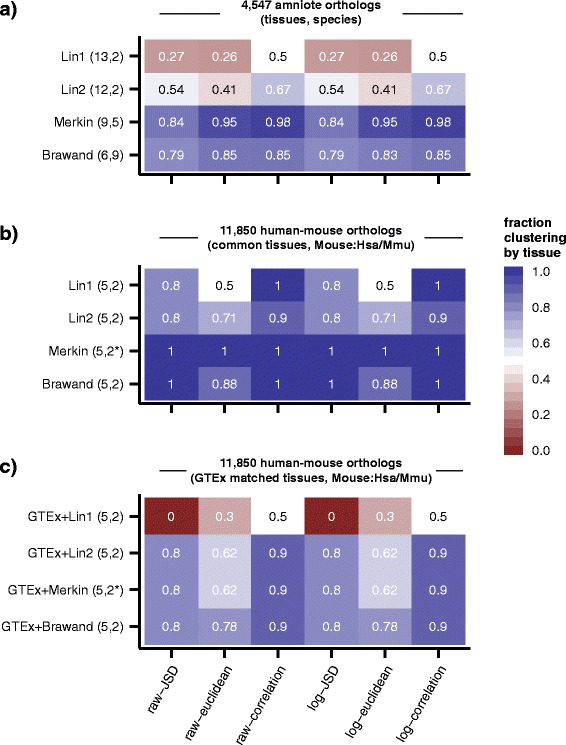
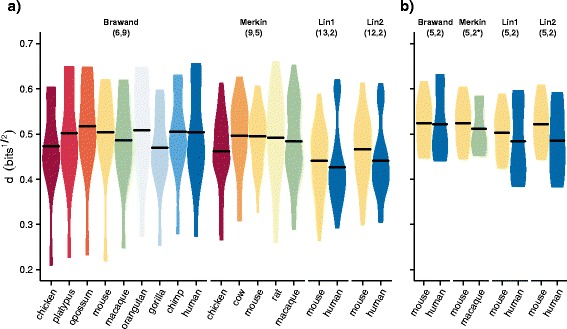
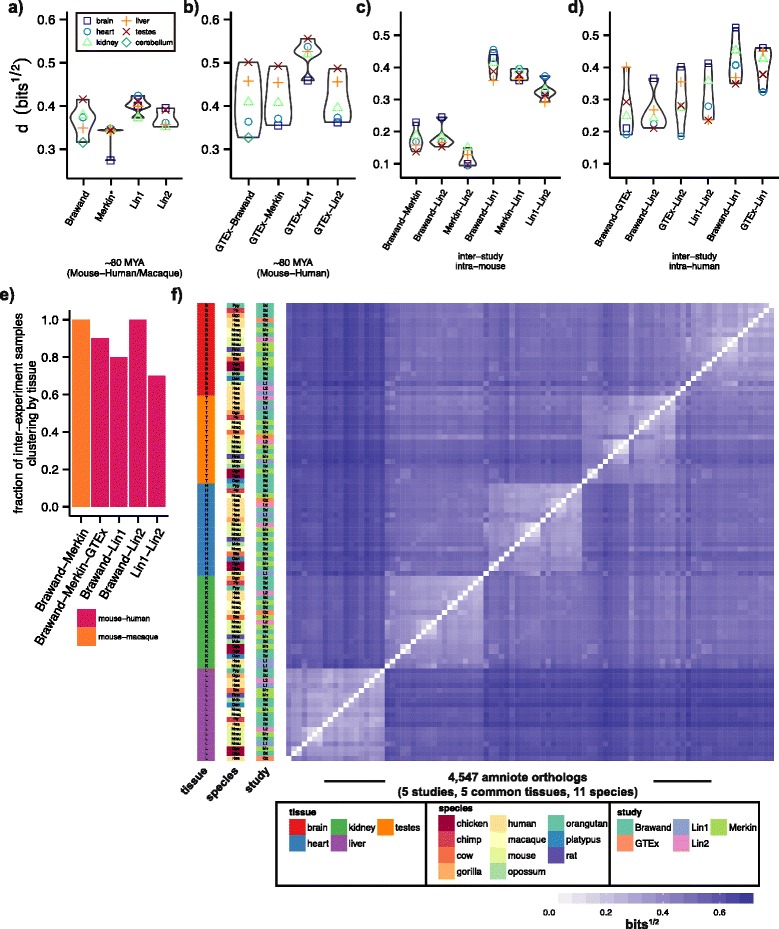
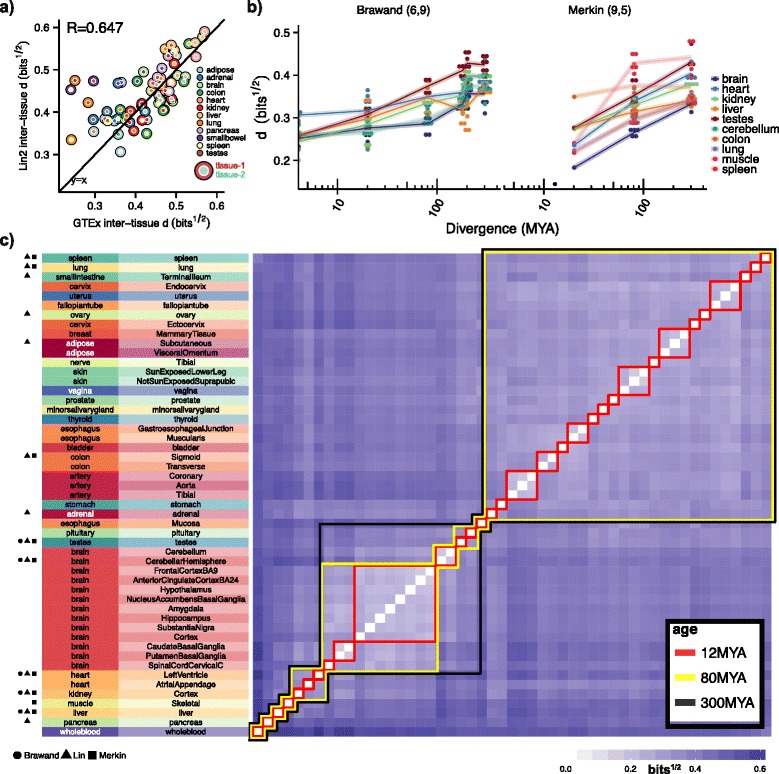
Results: To better understand gene expression evolution we reanalyzed data from four studies, including that of Lin, encompassing 6-13 tissues each from 11 vertebrate species using standardized mapping, normalization, and clustering methods. An analysis of independent data showed that the set of tissues chosen by Lin et al. were more similar to each other than those analyzed by previous studies. Comparing expression in five common tissues from the four studies, we observed that samples clustered exclusively by tissue rather than by species or study, supporting conservation of organ physiology in mammals. Furthermore, inter-study distances between homologous tissues were generally less than intra-study distances among different tissues, enabling informative meta-analyses. Notably, when comparing expression divergence of tissues over time to expression variation across 51 human GTEx tissues, we could accurately predict the clustering of expression for arbitrary pairs of tissues and species.

Conclusions: These results provide a framework for the design of future evolutionary studies of gene expression and demonstrate the utility of comparing RNA-seq data across studies.


Figures

Fig. 1
Fig. 1
Samples cluster largely by tissue across various studies and using a variety of distance metrics. Heat maps of the extent of interspecies tissue clustering, defined as the proportion of samples clustering most closely with a sample of a homologous tissue in a different species. Each heat map row represents a single set of samples assessed using various normalization methods and distance metrics (columns). a Representative samples (one per tissue/species) from four datasets spanning 11 species and from 6–13 tissues assessed over 4,547 common amniote orthologs. Lin1 and Lin2 represent identical library preparations sequenced at different times. b Mouse and human (*macaque was substituted for Merkin as no humans were assessed) samples assessed among the five tissues common to all studies (brain/cerebellum, testis, heart, kidney, and liver) over 11,850 human-mouse orthologs. c Mouse samples from each study paired with matched human tissues sequenced as part of the GTEx study assessed over 11,850 human/mouse orthologs in five common tissues
Fig. 2
Fig. 2
Typical inter-tissue distances are similar among most datasets, with Lin et al. tissues exhibiting smaller distances. The distribution of all pairwise distances among tissues within an individual species for various datasets is shown with the square root of the Jensen–Shannon Divergence (JSD½) as the distance metric throughout. a The distances among tissues calculated for all interspecies datasets using 4,547 orthologs common to the 11 amniotes assessed. Black bars indicate the mean. b The distribution of distances among the five tissues common to all studies assessed (brain/cerebellum, testis, heart, kidney, and liver), for mouse and human/macaque species over 11,850 human/mouse orthologs
Fig. 3
Fig. 3
Inter-study distances between homologous tissues are small enough to enable meta-analysis, yielding clustering by tissue across species and studies. a The distance (JSD½) between matched mouse and human/macaque tissues within studies. b The distance (JSD½) between matched mouse and GTEx human samples. The inter-study, intraspecies distances among (c) mouse tissues and (d) among human tissues. e The fraction of samples clustering most closely with a sample of the same tissue considering only inter-study relationships. f Heat map hierarchical super-clustering of 94 samples encompassing five shared tissues, five datasets, and 11 different species
Fig. 4
Fig. 4
Clustering by species or tissue is predictably dependent on the subset of tissues selected and the divergence times of the species analyzed. a Inter-tissue distance (JSD½) between Lin2 and GTEx human samples overlaid with line y = x. b The distance (JSD½) between matched tissues among species plotted as a function of evolutionary time for all tissues and species assessed in the Brawand and Merkin studies (n = 43). c Clustering heat map of 51 human tissues sequenced by GTEx. Distances represent the mean inter-tissue distance calculated among three individuals. Colored boxes indicate the flat clusters (groupings) formed for distance cutoffs corresponding to the mean interspecies tissue distance at specific divergence times. Tissues within a cluster have an inter-tissue distance lower than the mean interspecies distance between matched tissues. MYA million years ago
Fig. 5
Fig. 5
Inter-tissue distance matrices are conserved across species. a Within-species inter-tissue distances (JSD½) are plotted between pairs of species. Heat maps along the diagonal show the magnitude of inter-tissue distances for a particular species. b The relative ordering and magnitude of distances between tissues within species are shown. Distances between nodes along the x-axis represent the distance between the tissues at nodes i and i + 1 respectively. Vertical lines connecting homologous tissues are for visualization purposes. c A schematic model of the relationship between interspecies and intraspecies tissue distances as a function of evolutionary divergence. The red and black graphs represent the distances between four tissues (T1 to T4) in two different species. The graphs were drawn such that the mean distance between tissues in a species exceeds the interspecies distance between homologous tissues by roughly the observed ratio for a human–macaque comparison (bottom), a human–mouse comparison (middle), or a human–chicken comparison (top), and to agree with the result above that relative tissue differences tend to be conserved across species

Similar articles

Cited by

References

    1. Chan ET, Quon GT, Chua G, Babak T, Trochesset M, Zirngibl RA, et al. Conservation of core gene expression in vertebrate tissues. J Biol. 2009;8:33. doi: 10.1186/jbiol130. - DOI - PMC - PubMed
    1. Brawand D, Soumillon M, Necsulea A, Julien P, Csárdi G, Harrigan P, et al. The evolution of gene expression levels in mammalian organs. Nature. 2012;478:343–8. doi: 10.1038/nature10532. - DOI - PubMed
    1. Merkin J, Russell C, Chen P, Burge CB. Evolutionary dynamics of gene and isoform regulation in mammalian tissues. Science. 2012;338:1593–9. doi: 10.1126/science.1228186. - DOI - PMC - PubMed
    1. Barbosa-Morais NL, Irimia M, Pan Q, Xiong HY, Gueroussov S, Lee LJ, et al. The evolutionary landscape of alternative splicing in vertebrate species. Science. 2012;338:1587–93. doi: 10.1126/science.1230612. - DOI - PubMed
    1. Yue F, Cheng Y, Breschi A, Vierstra J, Wu W, Ryba T, Sandstrom R, Ma Z, Davis C, Pope BD, Shen Y, Pervouchine DD, Djebali S, Thurman RE, Kaul R, Rynes E, Kirilusha A, Marinov GK, Williams BA, Trout D, Amrhein H, Fisher-Aylor K, Antoshechkin I, DeSalvo G, See L-H, Fastuca M, Drenkow J, Zaleski C, Dobin A, Prieto P, et al. A comparative encyclopedia of DNA elements in the mouse genome. Nature. 2014;515:355–364. doi: 10.1038/nature13992. - DOI - PMC - PubMed

Publication types