. 2016 Feb 12;291(7):3595-612.
doi: 10.1074/jbc.M115.692442. Epub 2015 Dec 22.

The Kringle-like Domain Facilitates Post-endoplasmic Reticulum Changes to Premelanosome Protein (PMEL) Oligomerization and Disulfide Bond Configuration and Promotes Amyloid Formation

Affiliations

The Kringle-like Domain Facilitates Post-endoplasmic Reticulum Changes to Premelanosome Protein (PMEL) Oligomerization and Disulfide Bond Configuration and Promotes Amyloid Formation

Tina Ho et al. J Biol Chem. .

Abstract

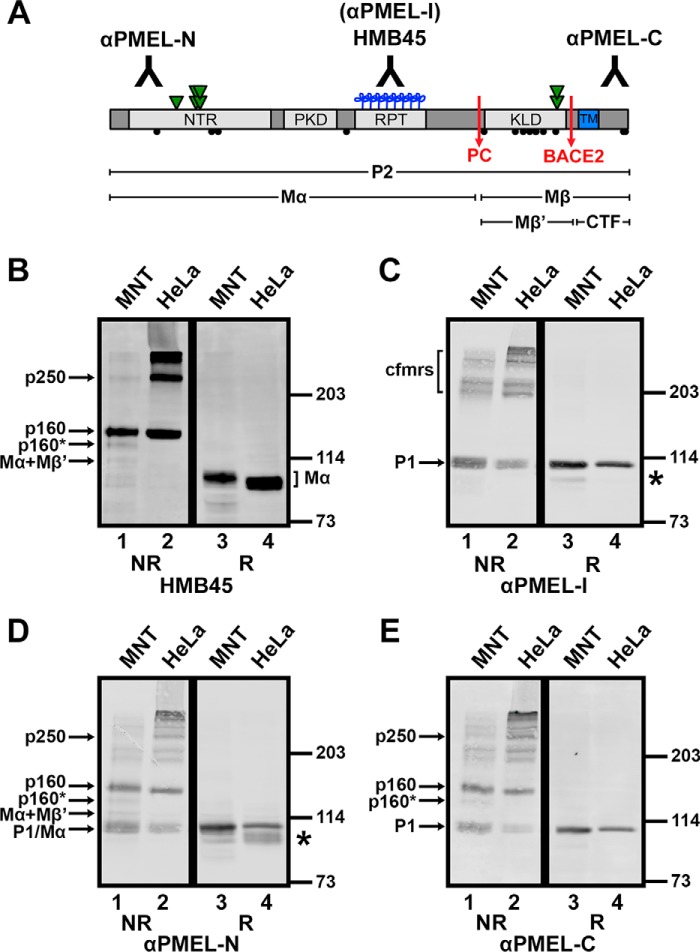
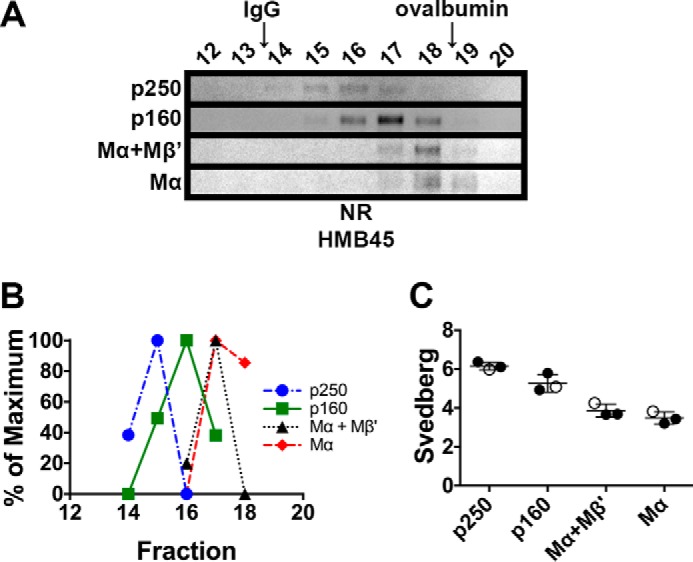
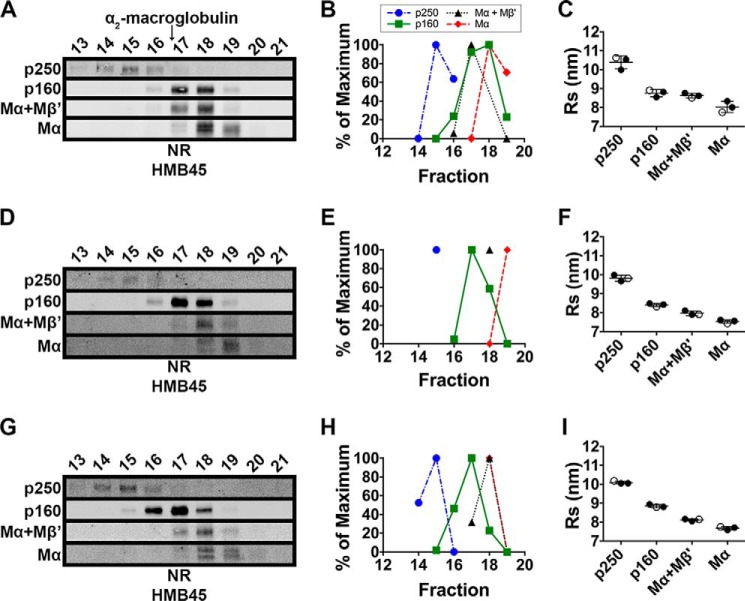
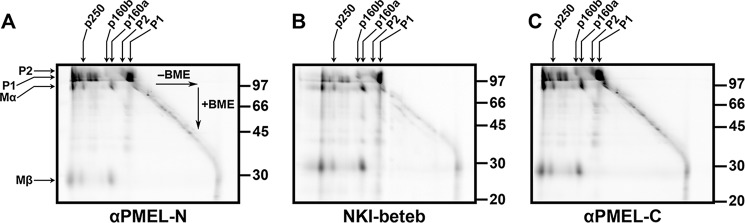
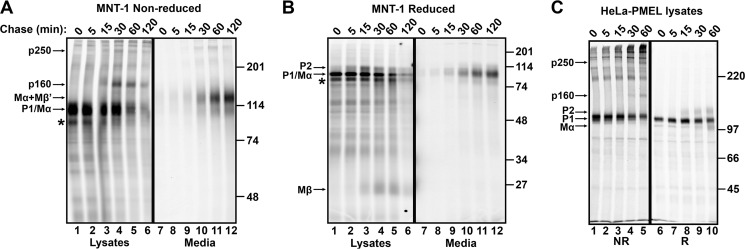
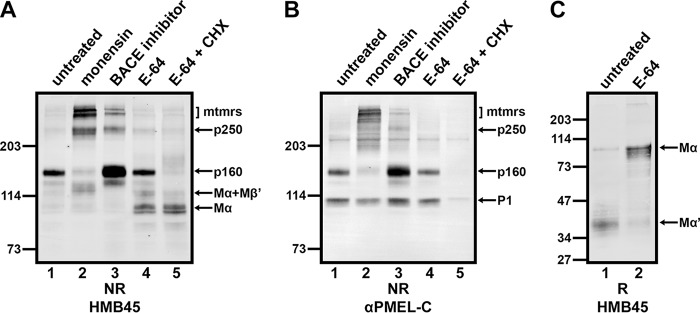
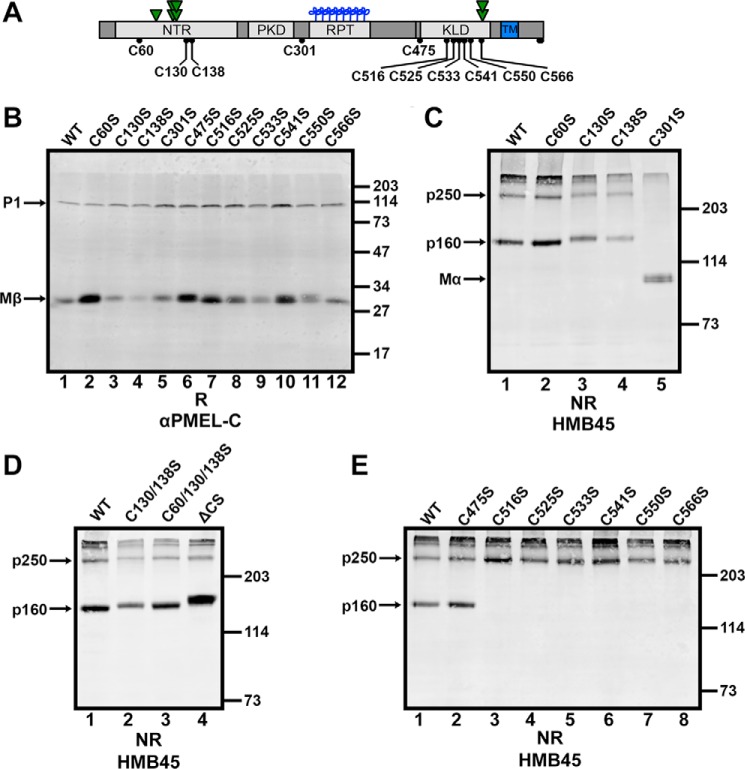
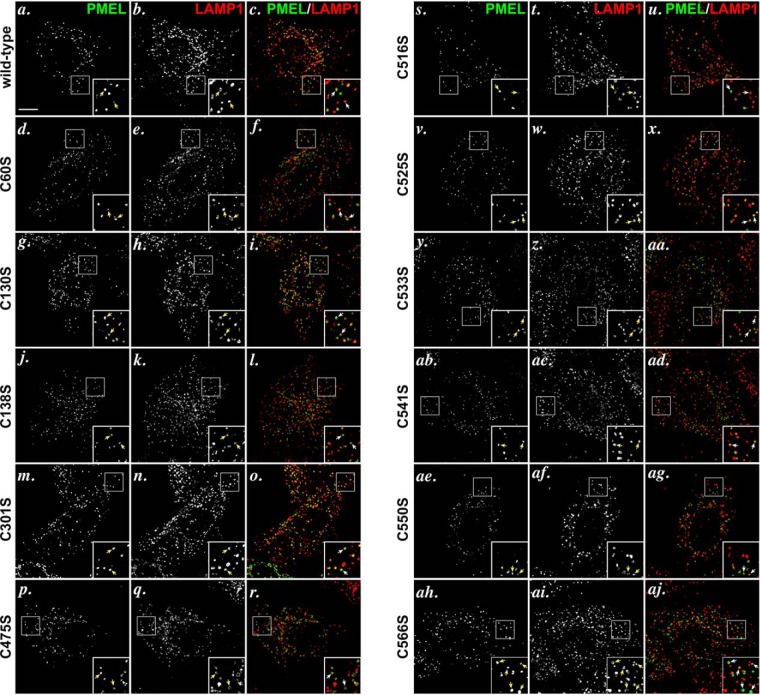
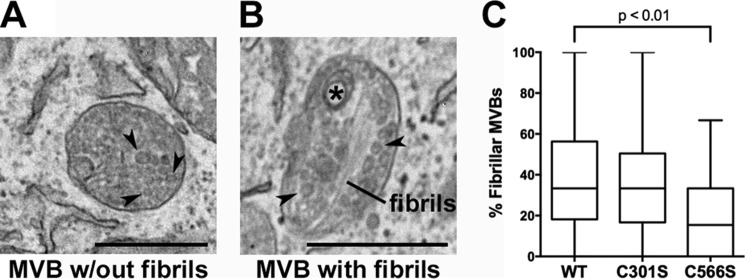
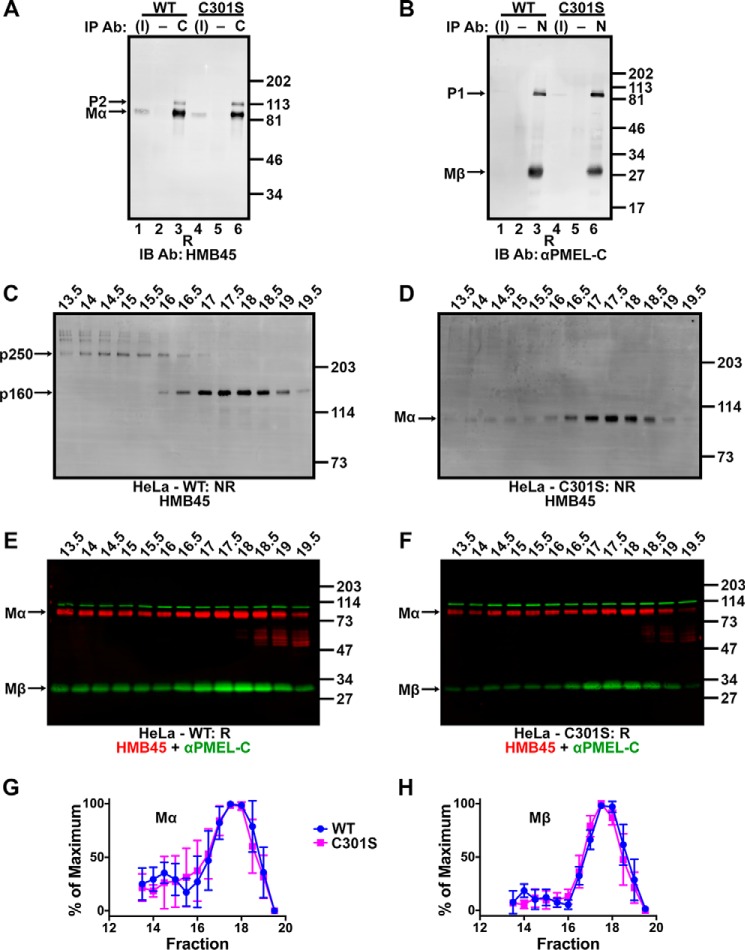
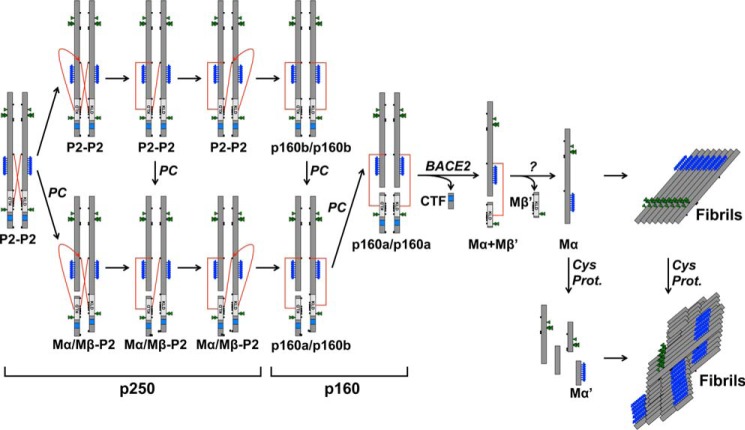
The formation of functional amyloid must be carefully regulated to prevent the accumulation of potentially toxic products. Premelanosome protein (PMEL) forms non-toxic functional amyloid fibrils that assemble into sheets upon which melanins ultimately are deposited within the melanosomes of pigment cells. PMEL is synthesized in the endoplasmic reticulum but forms amyloid only within post-Golgi melanosome precursors; thus, PMEL must traverse the secretory pathway in a non-amyloid form. Here, we identified two pre-amyloid PMEL intermediates that likely regulate the timing of fibril formation. Analyses by non-reducing SDS-PAGE, size exclusion chromatography, and sedimentation velocity revealed two native high Mr disulfide-bonded species that contain Golgi-modified forms of PMEL. These species correspond to disulfide bond-containing dimeric and monomeric PMEL isoforms that contain no other proteins as judged by two-dimensional PAGE of metabolically labeled/immunoprecipitated PMEL and by mass spectrometry of affinity-purified complexes. Metabolic pulse-chase analyses, small molecule inhibitor treatments, and evaluation of site-directed mutants suggest that the PMEL dimer forms around the time of endoplasmic reticulum exit and is resolved by disulfide bond rearrangement into a monomeric form within the late Golgi or a post-Golgi compartment. Mutagenesis of individual cysteine residues within the non-amyloid cysteine-rich Kringle-like domain stabilizes the disulfide-bonded dimer and impairs fibril formation as determined by electron microscopy. Our data show that the Kringle-like domain facilitates the resolution of disulfide-bonded PMEL dimers and promotes PMEL functional amyloid formation, thereby suggesting that PMEL dimers must be resolved to monomers to generate functional amyloid fibrils.

Keywords: Pmel17; cysteine-mediated cross-linking; disulfide; endosome; fibril; melanogenesis; melanosome; membrane trafficking; oxidation-reduction (redox); protein aggregation.


Figures

FIGURE 1.
FIGURE 1.
Golgi-matured PMEL exists predominantly in high Mr disulfide-bonded species. A, schematic diagram of the mature PMEL primary structure showing the sites of antibody recognition for αPMEL-N, αPMEL-I, HMB45, and αPMEL-C (note that αPMEL-I recognizes only the immature form of PMEL lacking O-glycans), cleavage sites for a proprotein convertase (PC) and BACE2 (red arrows), and resulting cleavage fragments Mα, Mβ, Mβ′, and CTF. Also noted are the domain structure, N-linked glycosylation sites (green triangles; double triangles indicate sites that are modified to the complex type in the Golgi), O-linked glycosylation sites (blue clovers), and cysteine residues (black circles). The N-terminal region (NTR), a region with homology to a repeated domain in polycystin 1 (PKD), a highly glycosylated RPT domain, and the KLD are indicated in light gray, and the transmembrane domain (TM) is indicated in blue. B–E, MNT-1 melanoma cells (MNT, lanes 1 and 3) or transiently transfected HeLa cells (lanes 2 and 4) expressing wild-type PMEL were lysed in buffer containing 1% (w/v) Triton X-100, and the soluble material was fractionated by SDS-PAGE under non-reducing (NR) or reducing (R) conditions. Proteins transferred to membranes were then probed with the PMEL antibodies HMB45 (B), αPMEL-I (C), αPMEL-N (D), or αPMEL-C (E). The migration of molecular weight standards is indicated to the right of each blot. Bands corresponding to p250, p160, p160*, Mα+Mβ′, Mα, immature PMEL conformers (cfmrs), and P1 are indicated by arrows. Note that Mα and P1 comigrate in MNT-1 cells and that free Mβ was run off the end of these gels. *, an alternatively spliced PMEL product (PMEL-ss). The lane numbers are indicated at the bottom.
FIGURE 2.
FIGURE 2.
p250, p160, and Mα monomers have distinct sedimentation properties. MNT-1 cell lysates prepared using 250 mm n-octylglucoside were subject to sedimentation velocity analyses in 5–20% sucrose gradients. A, aliquots of the gradient fractions were analyzed by non-reducing (NR) SDS-PAGE and immunoblotted using HMB45. Shown are regions of the immunoblots corresponding to p250, p160, Mα+Mβ′, and Mα, as indicated to the left. Fraction numbers are indicated above each lane (bottom of the gradient is to the left, and top of the gradient is to the right), and the migration of the globular protein standards, IgG and ovalbumin, are indicated with arrows at the top. Note that immunoblot contrast was optimally adjusted for each individual species. B, HMB45 immunoreactivity was quantified to determine the peak elution fraction for p250, p160, Mα+Mβ′, and Mα. The lowest value quantified for each species was set to 0%, and the highest value was set to 100%. C, Svedberg values were calculated for each species by comparing peak fractions with those of protein standards with known s values in three independent experiments. Circles, values calculated from each experiment; open circles, values calculated from the experiment shown in A and B; horizontal lines, mean value; error bars, S.D. Mean ± S.D. are also shown in Table 1.
FIGURE 3.
FIGURE 3.
p250, p160, and Mα monomers have distinct Stokes radii that are minimally altered by solubilization in detergents with different micelle sizes. MNT-1 cells were lysed using n-octylglucoside (A–C), dodecyl-β-d-maltoside (D–F), or Triton X-100 (G–I), and the detergent extracts were fractionated by size exclusion chromatography in the corresponding detergent. A, D, and G, eluted fractions were analyzed by SDS-PAGE under non-reducing (NR) conditions and immunoblotted using the HMB45 antibody. Shown are regions of the immunoblots corresponding to p250, p160, Mα+Mβ′, and Mα as indicated to the left. Fraction numbers are indicated above each lane, and the migration of α2-macroglobulin is indicated with an arrow. Note that immunoblot contrast was optimally adjusted for each individual species in each experiment. B, E, and H, HMB45 immunoreactivity was quantified to determine the elution volume of p250, p160, Mα+Mβ′, and Mα. The lowest value quantified for each species was set to 0% and the highest value was set to 100%. C, F, and I, the Stokes radius of each species was then calculated by comparing the peak elution fraction of that species with those of globular protein standards in three independent experiments. Circles, values calculated from each experiment; open circles, values calculated from the experiments shown in A, D, and G; horizontal lines, mean value; error bars, S.D. Mean ± S.D. are also shown in Table 1.
FIGURE 4.
FIGURE 4.
p250 and p160 comprise Golgi-matured P2 and Mα/Mβ fragments of PMEL. Transiently transfected HeLa cells expressing wild-type PMEL were metabolically labeled for 2 h with [35S]methionine/cysteine, immunoprecipitated using αPMEL-N (A), NKI-beteb (B), or αPMEL-C (C) and analyzed by two-dimensional PAGE under non-reducing conditions in the first dimension (left to right; −BME, β-mercaptoethanol) and under reducing conditions in the second dimension (top to bottom; +BME). The migrations of p250, p160a, p160b, P2, and P1 in the first dimension are indicated by arrows at the top; the migration of molecular weight standards in the second dimension is indicated to the right of each blot; and the positions of P2, P1, Mα, and Mβ in the second dimension are indicated on the left.
FIGURE 5.
FIGURE 5.
p250 and p160 are transient PMEL intermediates present only in cell lysates. A and B, MNT-1 cells were metabolically labeled with [35S]methionine/cysteine for 15 min and chased for the times indicated (min). PMEL in detergent cell lysates or culture media, as indicated, was then immunoprecipitated using NKI-beteb and fractionated by SDS-PAGE under non-reducing (A) or reducing (B) conditions. C, transiently transfected HeLa cells expressing wild-type PMEL (long form) were metabolically pulse labeled with [35S]methionine/cysteine for 10 min and chased for the indicated amounts of time. Cell lysates were then immunoprecipitated using αPMEL-C and fractionated by SDS-PAGE under non-reducing (NR, lanes 1–5) or reducing (R, lanes 6–10) conditions. The migration of molecular weight standards is shown to the right of each gel. Bands corresponding to p250, p160, Mα+Mβ′, P1, and Mα on the non-reducing gels and P2, P1, Mα, and Mβ on the reducing gels are indicated by arrows. Note that P1 and Mα largely comigrate in MNT-1 cells. *, product of alternatively spliced PMEL mRNA (PMEL-ss). Lane numbers are indicated across the bottom of each gel.
FIGURE 6.
FIGURE 6.
Potential precursor-product relationships among p250, p160, and Mα monomers. A and B, MNT-1 cells were untreated (lane 1) or treated for 3 h with 10 μm monensin (lane 2), 100 μm β-secretase inhibitor IV (lane 3), or 1 mg/ml E-64 (lanes 4 and 5). Cells treated with E-64 were then either immediately harvested (lane 4) or additionally treated with 10 μg/ml cycloheximide (CHX) in the presence of E-64 for 2 h (lane 5). After lysis in Triton X-100, detergent-soluble cell lysates were analyzed by non-reducing (NR) SDS-PAGE followed by immunoblotting with HMB45 (A) or αPMEL-C (B). C, MNT-1 cells that were untreated (lane 1) or treated for 2 days with 1 mg/ml E-64 (lane 2) were lysed in Triton X-100, and detergent-insoluble cell lysates were analyzed by reducing (R) SDS-PAGE followed by immunoblotting with HMB45. The migration of molecular weight standards is indicated to the left of each blot, and bands corresponding to p250, p160, Mα+Mβ′, Mα, P1, and Mα′ fragments and higher Mr multimers (mtmrs) are indicated with arrows.
FIGURE 7.
FIGURE 7.
p250 has a Cys-301-dependent intermolecular disulfide bond, and p160 has a Cys-301-dependent intramolecular disulfide bond. A, schematic from Fig. 1A showing luminal cysteine residues labeled with their amino acid numbers. For definitions of abbreviations, see the legend for Fig. 1. B–E, lysates from transiently transfected HeLa cells expressing wild-type (WT) PMEL, the indicated cysteine-to-serine mutants of PMEL, or the ΔCS variant was analyzed by reducing (R) SDS-PAGE and immunoblotted with αPMEL-C (B) or by non-reducing (NR) SDS-PAGE and immunoblotted with HMB45 (C–E). Single point mutants are analyzed in B, C, and E; double and triple mutants are analyzed in D together with ΔCS. The positions of molecular weight standards are indicated to the right of each blot, and relevant PMEL bands are indicated with arrows.
FIGURE 8.
FIGURE 8.
PMEL cysteine mutants traffic appropriately to late endosomal compartments when expressed in HeLa cells. HeLa cells transiently transfected with wild-type PMEL (a–c), PMEL C60S (d–f), PMEL C130S (g–i), C138S (j–l), C301S (m–o), C475S (p–r), C516S (s–u), C525S (v–x), C533S (y, z, and aa), C541S (ab–ad), C550S (ae–ag), or C566S (ah–aj) were fixed, labeled with antibodies to PMEL (NKI-beteb, red: a, d, g, j, m, p, s, v, y, ab, ae, and ah) and LAMP1 (H4A3, green: b, e, h, k, n, q, t, w, z, ac, af, and ai), and analyzed by deconvolution immunofluorescence microscopy. Shown are representative images of each label separately and merged together (c, f, i, l, o, r, u, x, aa, ad, ag, and aj). Arrows indicate examples of overlap between PMEL and LAMP1. Insets show ×4 magnification of the boxed regions. Scale bar represents 10 μm.
FIGURE 9.
FIGURE 9.
Cells expressing the C566S PMEL mutant, but not the C301S mutant, exhibit decreased fibril formation relative to those expressing wild type PMEL. HeLa cells transiently transfected with wild-type PMEL, the C301S mutant, or the C566S mutant were analyzed by transmission electron microscopy. A, example of a multivesicular body (MVB) with intraluminal vesicles (arrowheads). B, example of a multivesicular body with fibrils, intraluminal vesicles (arrowheads), and a small multilamellar structure commonly found in late endosomes and lysosomes (asterisk). C, fibril-containing organelles and multivesicular bodies without any evidence of fibril formation were quantified in at least one field of view/cell, and the percentage of fibril-containing multivesicular bodies was calculated for each cell. Box plots show the combined results of three experiments with the line in the center representing the median, the box representing the 25th and 75th percentiles, and the whiskers denoting the minimum and maximum values. Statistics were performed using a two-tailed unpaired t test comparing each mutant to wild-type PMEL. Scale bars are 500 nm.
FIGURE 10.
FIGURE 10.
Non-covalent complexes with properties similar to p250 and p160 persist despite Cys-301 mutagenesis. A and B, detergent-soluble lysates prepared from transiently transfected HeLa cells expressing wild-type PMEL (lanes 1–3) or PMEL C301S (lanes 4–6) were immunoprecipitated (IP) using αPMEL-C to the Mβ fragment (C; lanes 3 and 6 in A), NKI-beteb to the Mα fragment (N; lanes 3 and 6 in B) or matched negative (−) controls (normal rabbit serum in A, lanes 2 and 5, or the irrelevant monoclonal antibody OKT4 in B, lanes 2 and 5). The immunoprecipitated material and 3% of the inputs (I; lanes 1 and 4) were analyzed by reducing SDS-PAGE (R) and immunoblotted (IB) with antibodies to the opposite fragment: HMB45 to Mα (A) or αPMEL-C to Mβ (B). The migration of molecular weight standards are shown to the right; bands corresponding to P2, Mα, P1, and Mβ are indicated with arrows. C–F, HeLa cells transfected with wild-type PMEL (C and E) or the C301S PMEL variant (D and F) were lysed in 250 mm n-octylglucoside lysis buffer and the detergent extract fractionated by size exclusion chromatography in 25 mm n-octylglucoside running buffer. Eluted fractions were analyzed by SDS-PAGE under non-reducing (NR; C and D) or reducing (R; E and F) conditions and immunoblotted using the antibodies indicated. The migration of molecular weight standards is indicated to the right of each blot, and bands corresponding to p250, p160, Mα, and Mβ are indicated by arrows. Lanes are labeled with fraction numbers as presented in Fig. 3A. G and H, HMB45 and αPMEL-C immunoreactivity was quantified to determine the amount of Mα (G) and Mβ (H) present in each fraction. The lowest value quantified for each species was set to 0%, and the highest value was set to 100% for each experiment. Data represent the mean ± S.D. of three independent experiments.
FIGURE 11.
FIGURE 11.
Model of PMEL fibril formation. The schematic diagram shows the maturation of p250 into functional amyloid fibrils. The p250 PMEL dimer is resolved to p160 via disulfide bond rearrangement with proprotein convertase cleavage occurring before, during, or after this process. p160 is then cleaved by BACE2 to Mα+Mβ′, and Mβ′ is removed to produce free Mα by an as yet unknown process. Mα then assembles into fibrils and is concomitantly or subsequently cleaved by cysteine proteases into smaller fragments including Mα′. Note that the CTF is trafficked to lysosomes and is not incorporated into functional amyloid fibrils. The fate of Mβ′ is not known. For simplicity, only one subunit of the original dimer is shown after p160. The red lines represent disulfide bonds between Cys-301 and the KLD.

Similar articles

Cited by

References

    1. Chiti F., and Dobson C. M. (2006) Protein misfolding, functional amyloid, and human disease. Annu. Rev. Biochem. 75, 333–366 - PubMed
    1. Skovronsky D. M., Lee V. M., and Trojanowski J. Q. (2006) Neurodegenerative diseases: new concepts of pathogenesis and their therapeutic implications. Annu. Rev. Pathol. 1, 151–170 - PubMed
    1. Fowler D. M., Koulov A. V., Balch W. E., and Kelly J. W. (2007) Functional amyloid: from bacteria to humans. Trends Biochem. Sci. 32, 217–224 - PubMed
    1. Chapman M. R., Robinson L. S., Pinkner J. S., Roth R., Heuser J., Hammar M., Normark S., and Hultgren S. J. (2002) Role of Escherichia coli curli operons in directing amyloid fiber formation. Science 295, 851–855 - PMC - PubMed
    1. Majumdar A., Cesario W. C., White-Grindley E., Jiang H., Ren F., Khan M. R., Li L., Choi E. M., Kannan K., Guo F., Unruh J., Slaughter B., and Si K. (2012) Critical role of amyloid-like oligomers of Drosophila Orb2 in the persistence of memory. Cell 148, 515–529 - PubMed

Publication types

MeSH terms

LinkOut - more resources