. 2015 Dec 22:3:87.
doi: 10.1186/s40478-015-0267-2.

Small heat shock proteins are induced during multiple sclerosis lesion development in white but not grey matter

Affiliations

Small heat shock proteins are induced during multiple sclerosis lesion development in white but not grey matter

Laura A N Peferoen et al. Acta Neuropathol Commun. .

Abstract

Introduction: The important protective role of small heat-shock proteins (HSPs) in regulating cellular survival and migration, counteracting protein aggregation, preventing apoptosis, and regulating inflammation in the central nervous system is now well-recognized. Yet, their role in the neuroinflammatory disorder multiple sclerosis (MS) is largely undocumented. With the exception of alpha B-crystallin (HSPB5), little is known about the roles of small HSPs in disease.

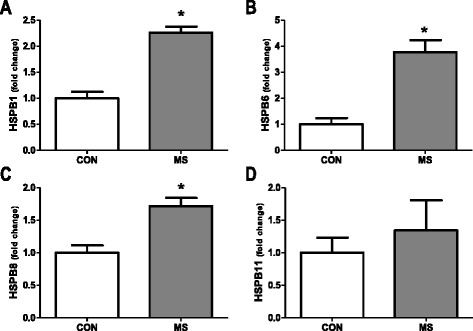
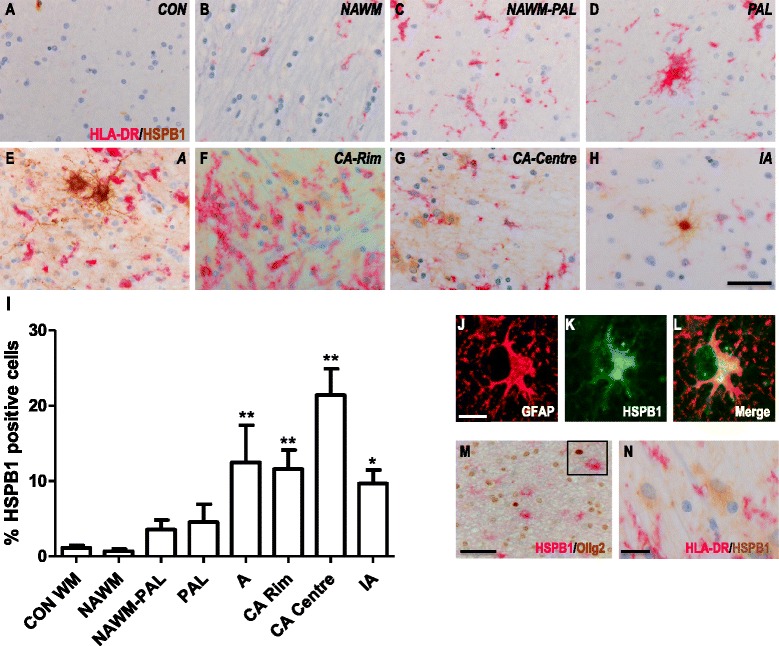
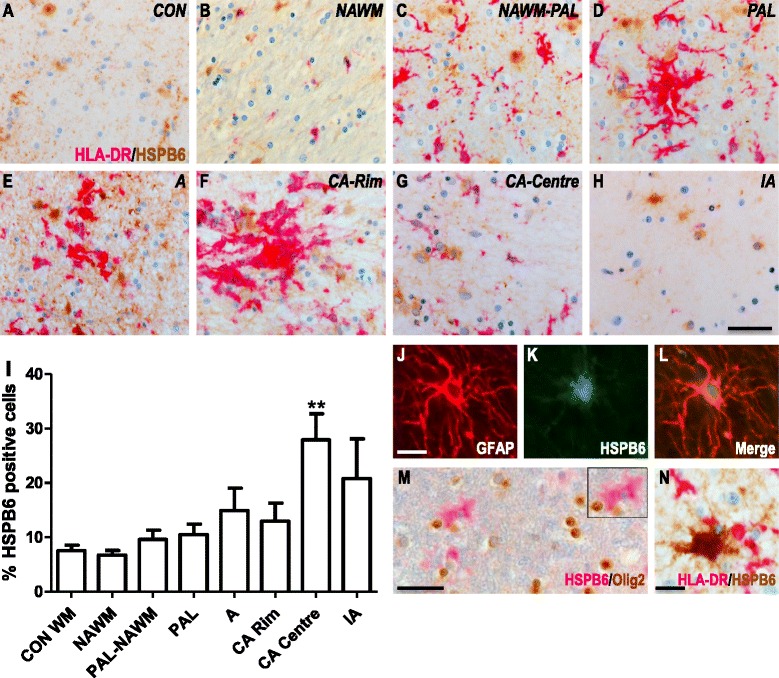
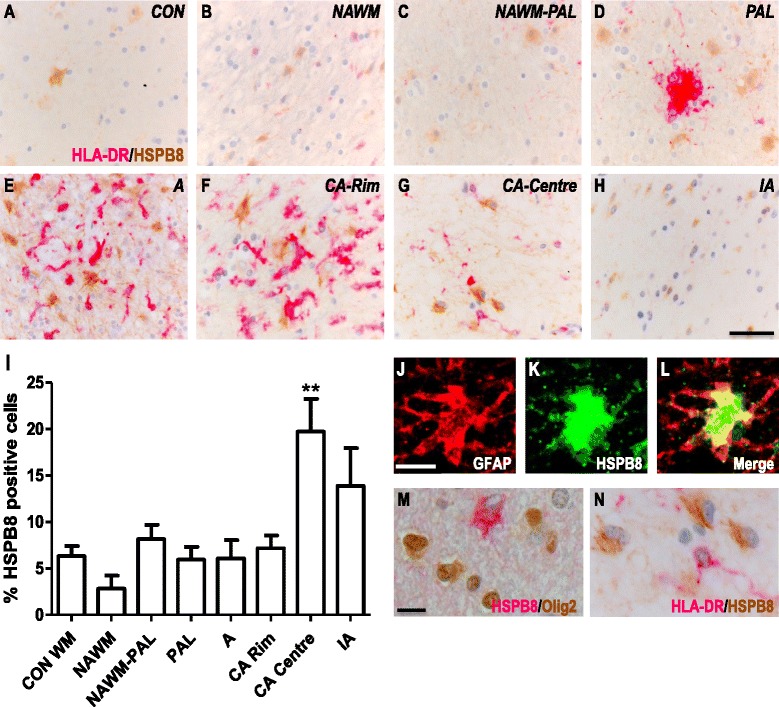
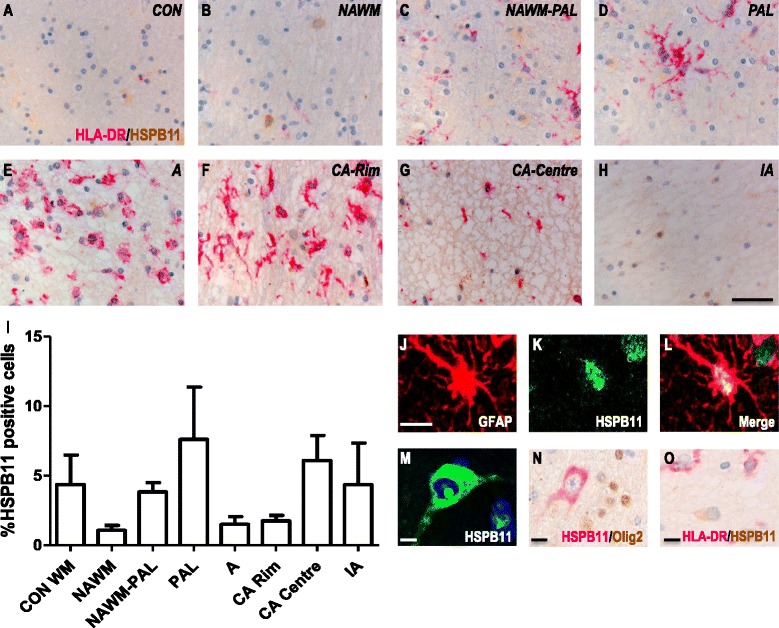
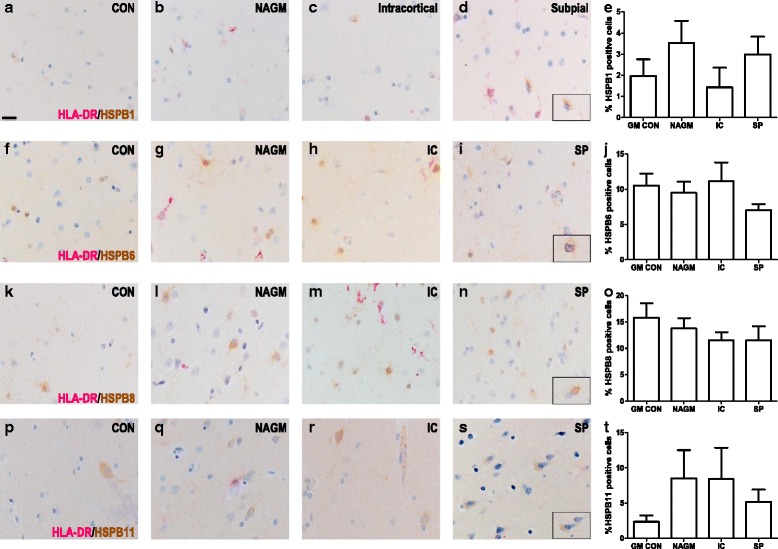
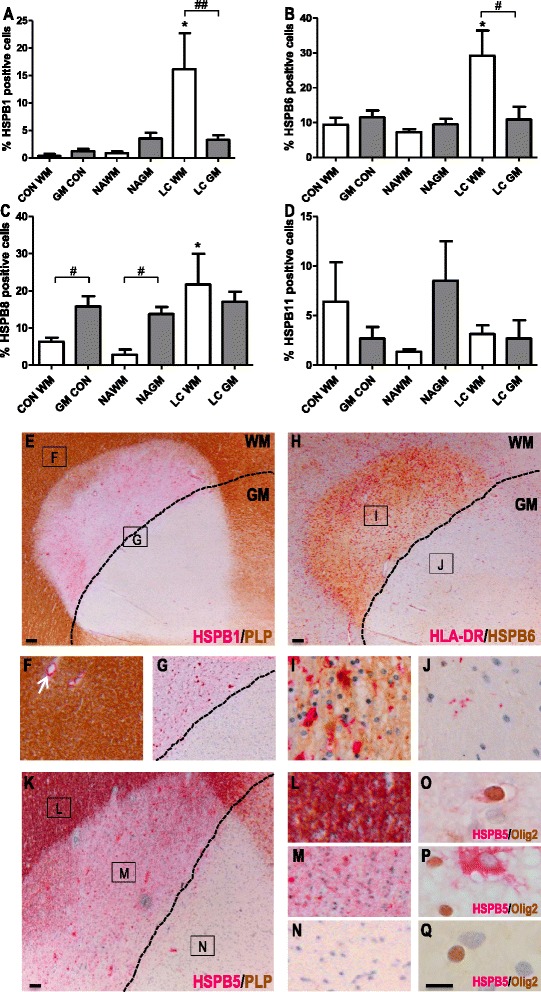
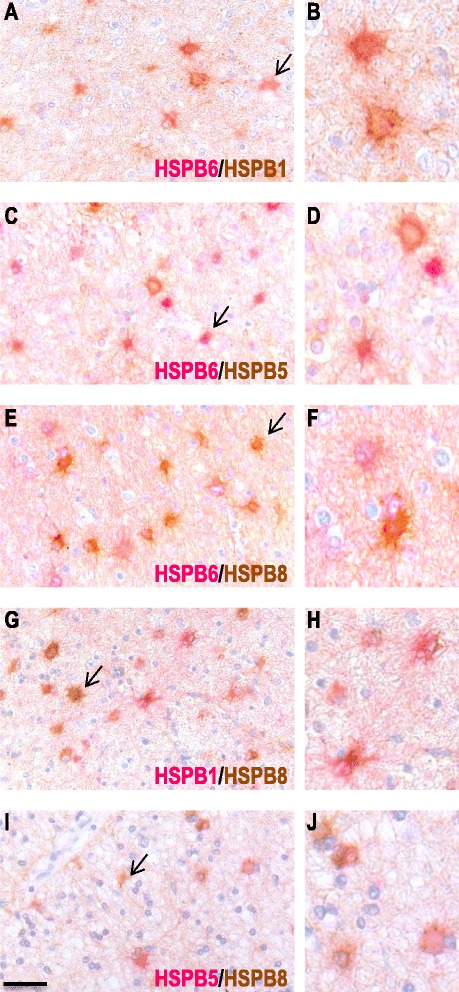
Results: Here, we examined the expression of four small HSPs during lesion development in MS, focussing on their cellular distribution, and regional differences between white matter (WM) and grey matter (GM). It is well known that MS lesions in these areas differ markedly in their pathology, with substantially more intense blood-brain barrier damage, leukocyte infiltration and microglial activation typifying WM but not GM lesions. We analysed transcript levels and protein distribution profiles for HSPB1, HSPB6, HSPB8 and HSPB11 in MS lesions at different stages, comparing them with normal-appearing brain tissue from MS patients and non-neurological controls. During active stages of demyelination in WM, and especially the centre of chronic active MS lesions, we found significantly increased expression of HSPB1, HSPB6 and HSPB8, but not HSPB11. When induced, small HSPs were exclusively found in astrocytes but not in oligodendrocytes, microglia or neurons. Surprisingly, while the numbers of astrocytes displaying high expression of small HSPs were markedly increased in actively demyelinating lesions in WM, no such induction was observed in GM lesions. This difference was particularly obvious in leukocortical lesions covering both WM and GM areas.

Conclusions: Since induction of small HSPs in astrocytes is apparently a secondary response to damage, their differential expression between WM and GM likely reflects differences in mediators that accompany demyelination in either WM or GM during MS. Our findings also suggest that during MS, cortical structures fail to benefit from the protective actions of small HSPs.


Figures

Fig. 1
Fig. 1
Transcript levels of small heat shock proteins in control white matter and NAWM in MS patients. Real time PCR analysis of transcripts encoding HSPB1 (a), HSPB6 (b), HSPB8 (c) and HSPB11 (d) comparing white matter from non-neurological controls (n = 3) and MS patients (n = 4). Data represent mean ± SEM and are expressed relative to the housekeeping gene EF-1α. *p < 0.05
Fig. 2
Fig. 2
HSPB1 expression in white matter MS lesions. Representative images of white matter tissues from non-neurological controls (a) and MS cases (bh) double labelled for HLA-DR (pink) and HSPB1 (brown). NAWM (b), NAWM surrounding a preactive lesion (c), preactive lesion (d), active lesion (e), chronic active lesion (f- rim, g - centre) and inactive lesions (h) from MS cases. Quantification of HSPB1+ cells in lesion areas (i). GFAP+ astrocytes co-localise with HSPB1 (jl), while Olig2+ oligodendrocytes (m) or HLA-DR+ microglia (m) do not express HSPB1. Percentages of cells in each area (i). Data are shown as mean ± SEM. Significance was analysed between the control and NAWM, or the NAWM group and the different lesion types using the Mann-Whitney U test. *p < 0.05, **p < 0.01. Scale bar (ah), (mn) = 50 μm, (jl) = 10 μm. CON = control, NAWM = normal appearing white matter, PAL = preactive lesions, A = active lesion, CA = chronic active lesion, IA = inactive lesions
Fig. 3
Fig. 3
HSPB6 expression in white matter MS lesions. Representative images of white matter tissues from non-neurological controls (a) and MS cases (bh) double labelled for HLA-DR (pink) and HSPB6 (brown). NAWM (b), NAWM surrounding a preactive lesion (c), preactive lesion (d), active lesion (e), chronic active lesion (f- rim, g - centre) and inactive lesions (h) from MS cases. Quantification of HSPB6+ cells in lesion areas (i). GFAP+ astrocytes co-localise with HSPB6 (jl), while Olig2+ oligodendrocytes (m) or HLA-DR+ microglia (n) do not express HSPB6. Percentages of cells in each area (I). Data are shown as mean ± SEM. Mann-Whitney U tests were performed for comparisons between control white matter and NAWM and between NAWM and the different lesion types. **p < 0.01. Scale bar (ah, m) = 50 μm, (jl, n) = 10 μm. CON = control, NAWM = normal appearing white matter, PAL = preactive lesions, A = active lesion, CA = chronic active lesion, IA = inactive lesions
Fig. 4
Fig. 4
HSPB8 expression in white matter MS lesions. Representative images of white matter tissues from non-neurological controls (a) and MS cases (bh) double labelled for HLA-DR (pink) and HSPB8 (brown). NAWM (b), NAWM surrounding a preactive lesion (c), preactive lesion (d), active lesion (e), chronic active lesion (f- rim, g - centre) and inactive lesions (h) from MS cases. Quantification of HSPB8+ cells in lesion areas (i). GFAP+ astrocytes co-localise with HSPB8 (jl), while Olig2+ oligodendrocytes (m) or HLA-DR+ microglia (n) do not express HSPB8. Percentages of cells in each area (I). Data are shown as mean ± SEM. Mann-Whitney U tests were performed for comparisons between control white matter and NAWM and between NAWM and the different lesion types. **p < 0.01. Scale bar (ah) = 50 μm, (jn) = 10 μm. CON = control, NAWM = normal appearing white matter, PAL = preactive lesions, A = active lesion, CA = chronic active lesion, IA = inactive lesions
Fig. 5
Fig. 5
HSPB11 expression in white matter MS lesions. Images of white matter tissues from non-neurological controls (a) and MS cases (bh) double labelled for HLA-DR (pink) and HSPB11 (brown). NAWM (b), NAWM surrounding a preactive lesion (c), preactive lesion (d), active lesion (e), chronic active lesion (f- rim, g - centre) and inactive lesions (h) from MS cases. Quantification of HSPB11+ cells in lesion areas (i). HSPB11 co-localises with GFAP+ astrocytes (jl), and is expressed by white matter neurons (m) while Olig2+ oligodendrocytes (n) or HLA-DR+ microglia (o) do not express HSPB11. Percentages of cells in each area (i). Data are shown as mean ± SEM. Statistical analysis is performed by Mann- Whitney U test, comparing control white matter and NAWM or NAWM and the separate lesion types, no significant differences are found. Scale bar (ah) = 50 μm, (jo) = 10 μm. CON = control, NAWM = normal appearing white matter, PAL = preactive lesions, A = active lesion, CA = chronic active lesions, IA = inactive lesions
Fig. 6
Fig. 6
Expression pattern of the small HSP in cortical MS lesions. Grey matter from non-neurological cases and NAGM, intracortical demyelination and subpial lesions from MS cases were double labelled with HLA-DR (pink) and the small HSPs (brown), HSPB1 (a), HSPB6 (b), HSPB8 (c) or HSPB11 (d). Quantification revealed no correlation between the expression pattern of the small HSPs and cortical damage (A5, B5, C5, D5). NAGM was compared versus the control, intracortical and subpial groups by the use of Mann-Whitney U test. Scale bar = 25 μm. CON = control, NAGM = normal appearing grey matter, IC = intracortical, SP = subpial
Fig. 7
Fig. 7
Small HSP expression in leukocortical MS lesions. Expression of HSPB1 (a), HSPB6 (b), HSPB8 (c) and HSPB11 (d) was quantified in the white matter (white bars) and grey matter (grey bars) area of leukocortical MS lesions compared to NAWM and NAGM in MS cases, and control white and grey matter in controls. e A leukocortical lesion identified by a focal area of myelin loss depicted by PLP staining (brown). The border between WM and GM is depicted by a black line (also in g, h and k). Immunohistochemistry shows the marked difference in HSPB1 expression in the WM and GM parts of the LC lesion. f In the NAWM HSPB1 expression is limited to blood vessels (arrow). g Enlargement of area in (e) shows HSPB1 expression (pink) is restricted to the white matter part of the lesion. h HSPB6 expression (brown) in an active leukocortical lesion containing HLA-DR+ microglia/macrophages (pink) restricted to the WM part (i). HSPB6 is highly expressed in the WM part (i) and absent in the grey matter part (j). k A leukocortical lesion identified by a focal area of myelin loss depicted by PLP staining (brown). HSPB5 (pink) is selectively expressed in oligodendrocytes in preactive lesions (data not shown) in NAWM close to the WM/GM border (l, o), while in the active WM part (m) HSPB5 accumulates also in astrocytes (p) but not in the GM part of the lesion (n, q). Statistical analysis (ad) is performed by a Mann-Whitney U test, comparing white and grey matter groups with each other (#) or comparing NAWM or NAGM with the control or lesion group (*) . # p < 0.05; ## p < 0.01; *p < 0.05. Scale bars e, h, k = 100 μm; oq = 50 μm; fg, ij, ln = digitally zoomed in. CON = control, WM = white matter, GM = grey matter; NAWM = normal appearing white matter, NAGM = normal appearing grey matter, LC = leukocortical lesions
Fig. 8
Fig. 8
Double immunolabelling for combinations of different sHSPs. Representative images of active white matter lesions double labelled for HSPB6 (pink) and HSPB1 (brown; ab), HSPB6 (pink) and HSPB5 (brown; cd), HSPB6 (pink) and HSPB8 (brown; ef), HSPB1 (pink) and HSPB8 (brown; gh) and HSPB5 (pink) and HSPB8 (brown; ij). Most astrocytes are double labelled, yet some show single staining; examples are indicated by the arrows. Scale bar = 50 μm, b, d, f, h, j are digitally zoomed in

Similar articles

Cited by

References

    1. Kamm CP, Uitdehaag BM, Polman CH. Multiple sclerosis: current knowledge and future outlook. Eur Neurol. 2014;72:132–141. doi: 10.1159/000360528. - DOI - PubMed
    1. Richter-Landsberg C. Heat shock proteins in neural cells. New York: Springer; 2009.
    1. Prins M, Schul E, Geurts J, van der Valk P, Drukarch B, van Dam A-M. Pathological differences between white and grey matter multiple sclerosis lesions. Ann N Y Acad Sci. 2015;1351:99–113. doi: 10.1111/nyas.12841. - DOI - PubMed
    1. Calabrese M, Favaretto A, Martini V, Gallo P. Grey matter lesions in MS: from histology to clinical implications. Prion. 2013;7:20–27. doi: 10.4161/pri.22580. - DOI - PMC - PubMed
    1. Lassmann H. Pathology and disease mechanisms in different stages of multiple sclerosis. J Neurol Sci. 2013;333:1–4. doi: 10.1016/j.jns.2013.05.010. - DOI - PubMed

Publication types

MeSH terms