

Probabilistic modelling of prospective environmental concentrations of gold nanoparticles from medical applications as a basis for risk assessment
- PMID: 26694868
- PMCID: PMC4688950
- DOI: 10.1186/s12951-015-0150-0
Probabilistic modelling of prospective environmental concentrations of gold nanoparticles from medical applications as a basis for risk assessment
Abstract
Background: The use of gold nanoparticles (Au-NP) based medical applications is rising due to their unique physical and chemical properties. Diagnostic devices based on Au-NP are already available in the market or are in clinical trials and Au-NP based therapeutics and theranostics (combined diagnostic and treatment modality) are in the research and development phase. Currently, no information on Au-NP consumption, material flows to and concentrations in the environment are available. Therefore, we estimated prospective maximal consumption of Au-NP from medical applications in the UK and US. We then modelled the Au-NP flows post-use and predicted their environmental concentrations. Furthermore, we assessed the environment risks of Au-NP by comparing the predicted environmental concentrations (PECs) with ecological threshold (PNEC) values.
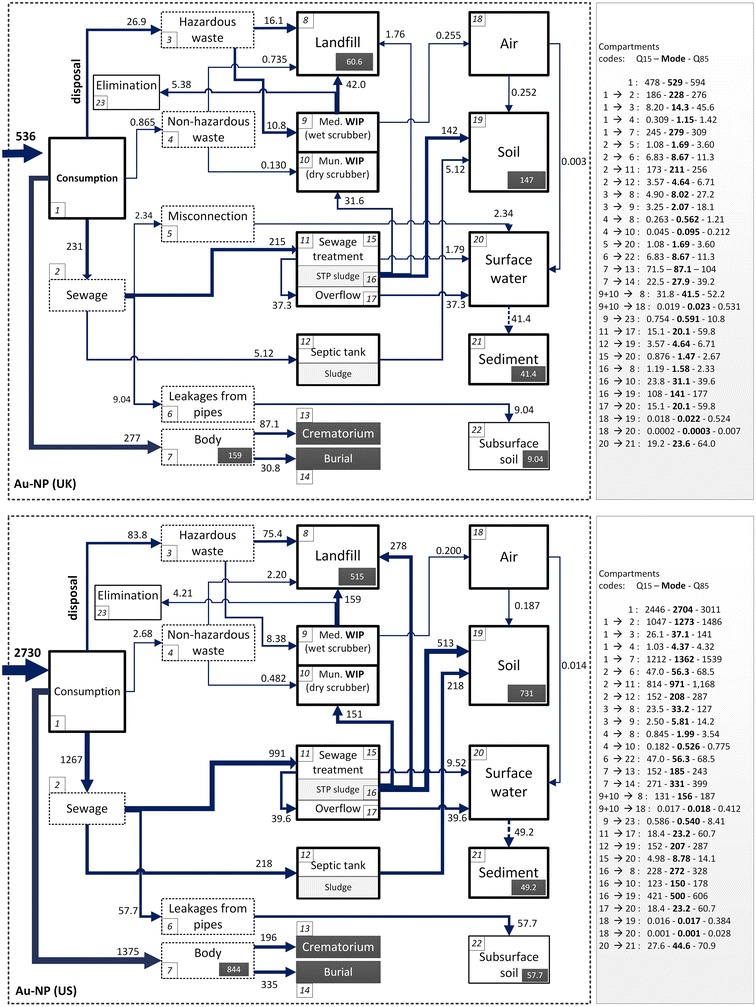
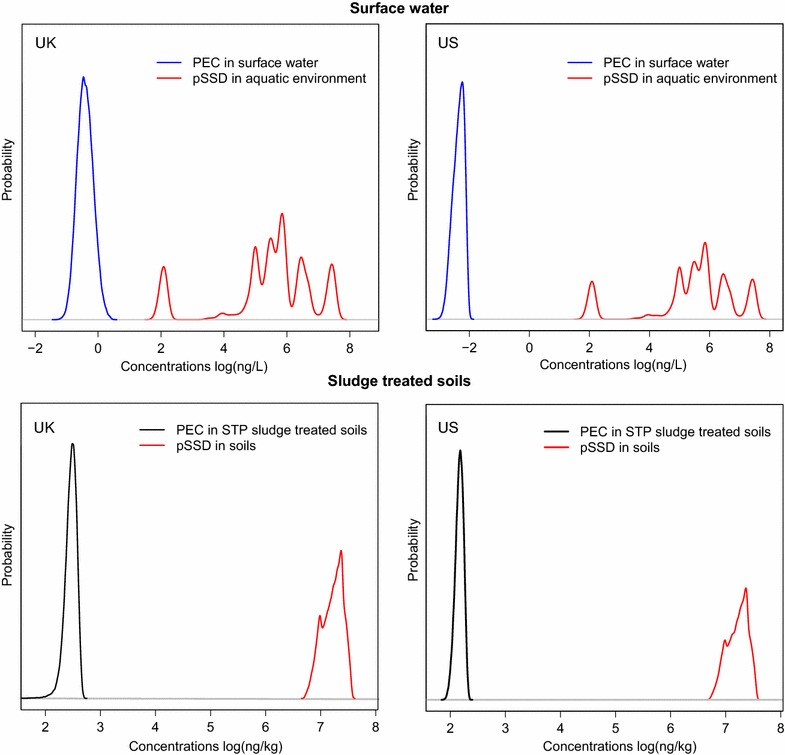
Results: The mean annual estimated consumption of Au-NP from medical applications is 540 kg for the UK and 2700 kg for the US. Among the modelled concentrations of Au-NP in environmental compartments, the mean annual PEC of Au-NP in sludge for both the UK and US was estimated at 124 and 145 μg kg(-1), respectively. The mean PEC in surface water was estimated at 468 and 4.7 pg L(-1), respectively for the UK and US. The NOEC value for the water compartment ranged from 0.12 up to 26,800 μg L(-1), with most values in the range of 1000 μg L(-1).
Conclusion: The results using the current set of data indicate that the environmental risk from Au-NP used in nanomedicine in surface waters and from agricultural use of biosolids is minimal in the near future, especially because we have used a worst-case use assessment. More Au-NP toxicity studies are needed for the soil compartment.
Figures
Similar articles
-
Probabilistic modeling of the flows and environmental risks of nano-silica.Sci Total Environ. 2016 Mar 1;545-546:67-76. doi: 10.1016/j.scitotenv.2015.12.100. Epub 2015 Dec 31. Sci Total Environ. 2016. PMID: 26745294
-
Probabilistic environmental risk assessment of five nanomaterials (nano-TiO2, nano-Ag, nano-ZnO, CNT, and fullerenes).Nanotoxicology. 2016;10(4):436-44. doi: 10.3109/17435390.2015.1073812. Epub 2015 Nov 10. Nanotoxicology. 2016. PMID: 26554717
-
Hydrophilic polymer monolithic capillary microextraction online coupled to ICPMS for the determination of carboxyl group-containing gold nanoparticles in environmental waters.Anal Chem. 2015 Feb 3;87(3):1789-96. doi: 10.1021/ac503798c. Epub 2015 Jan 22. Anal Chem. 2015. PMID: 25572871
-
Challenges in assessing release, exposure and fate of silver nanoparticles within the UK environment.Environ Sci Process Impacts. 2013 Oct;15(11):2050-8. doi: 10.1039/c3em00226h. Environ Sci Process Impacts. 2013. PMID: 24056694 Review.
-
Silver nanoparticles: behaviour and effects in the aquatic environment.Environ Int. 2011 Feb;37(2):517-31. doi: 10.1016/j.envint.2010.10.012. Epub 2010 Dec 14. Environ Int. 2011. PMID: 21159383 Review.
Cited by
-
Probabilistic risk assessment of gold nanoparticles after intravenous administration by integrating in vitro and in vivo toxicity with physiologically based pharmacokinetic modeling.Nanotoxicology. 2018 Jun;12(5):453-469. doi: 10.1080/17435390.2018.1459922. Epub 2018 Apr 14. Nanotoxicology. 2018. PMID: 29658401 Free PMC article.
-
Current Knowledge on the Use of Computational Toxicology in Hazard Assessment of Metallic Engineered Nanomaterials.Int J Mol Sci. 2017 Jul 12;18(7):1504. doi: 10.3390/ijms18071504. Int J Mol Sci. 2017. PMID: 28704975 Free PMC article. Review.
-
Growth-Promoting Gold Nanoparticles Decrease Stress Responses in Arabidopsis Seedlings.Nanomaterials (Basel). 2021 Nov 23;11(12):3161. doi: 10.3390/nano11123161. Nanomaterials (Basel). 2021. PMID: 34947510 Free PMC article.
-
Shape and Charge of Gold Nanomaterials Influence Survivorship, Oxidative Stress and Moulting of Daphnia magna.Nanomaterials (Basel). 2016 Nov 25;6(12):222. doi: 10.3390/nano6120222. Nanomaterials (Basel). 2016. PMID: 28335350 Free PMC article.
-
Risk Management Framework for Nano-Biomaterials Used in Medical Devices and Advanced Therapy Medicinal Products.Materials (Basel). 2020 Oct 13;13(20):4532. doi: 10.3390/ma13204532. Materials (Basel). 2020. PMID: 33066064 Free PMC article.
References
-
- World Gold Council. Number of published patents including the words ‘gold’ and ‘nanoparticles’. http://www.gold.org/advanced_by_gold/#!science#gold-applications-en. Accessed 4 Jan 2015.
-
- Title search = (health* or medic* or therap* or diseas* or cancer* or HIV or AID*) AND title search = (nano* or ultra small) AND (gold or Au) -Time period: 2004-2014 [database on the Internet]. Accessed: 28 December 2014.
-
- Trudel S. Unexpected magnetism in gold nanostructures: making gold even more attractive. Gold Bull. 2011;44(1):3–13. doi: 10.1007/s13404-010-0002-5. - DOI
Publication types
MeSH terms
Substances
Grants and funding
LinkOut - more resources
Full Text Sources
Other Literature Sources
Miscellaneous
