. 2016 Jan 11;213(1):75-92.
doi: 10.1084/jem.20142350. Epub 2015 Dec 22.

XCR1+ dendritic cells promote memory CD8+ T cell recall upon secondary infections with Listeria monocytogenes or certain viruses

Affiliations

XCR1+ dendritic cells promote memory CD8+ T cell recall upon secondary infections with Listeria monocytogenes or certain viruses

Yannick O Alexandre et al. J Exp Med. .

Abstract

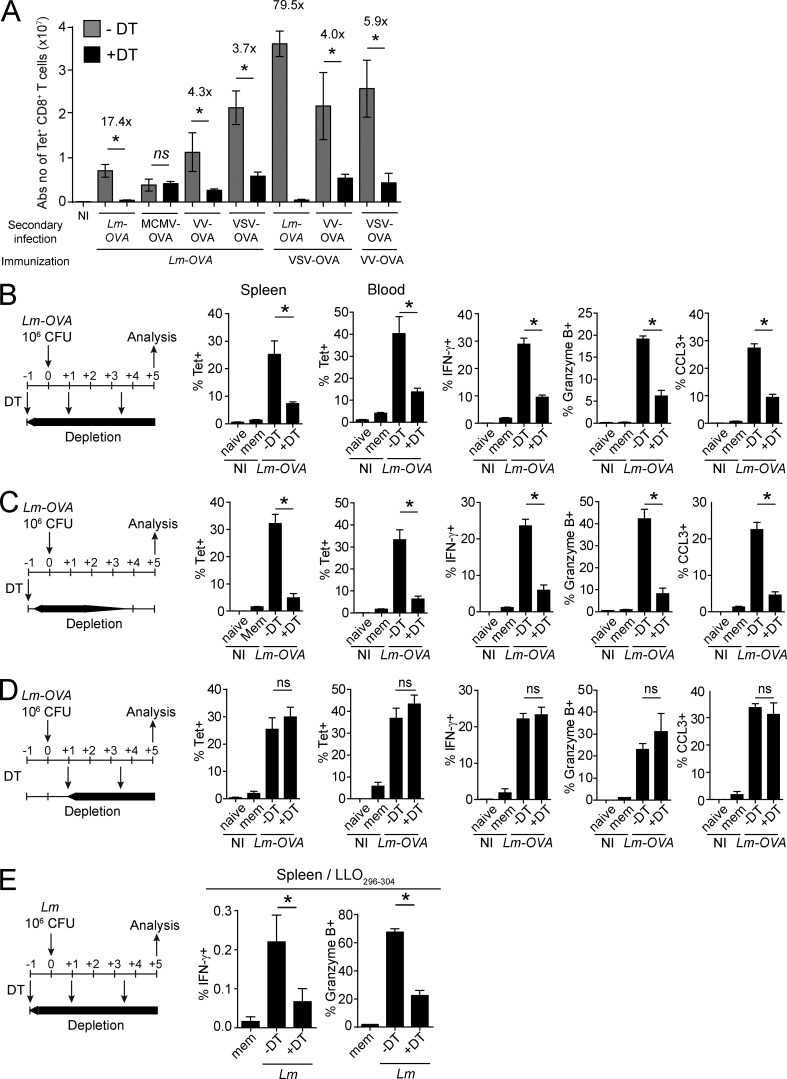
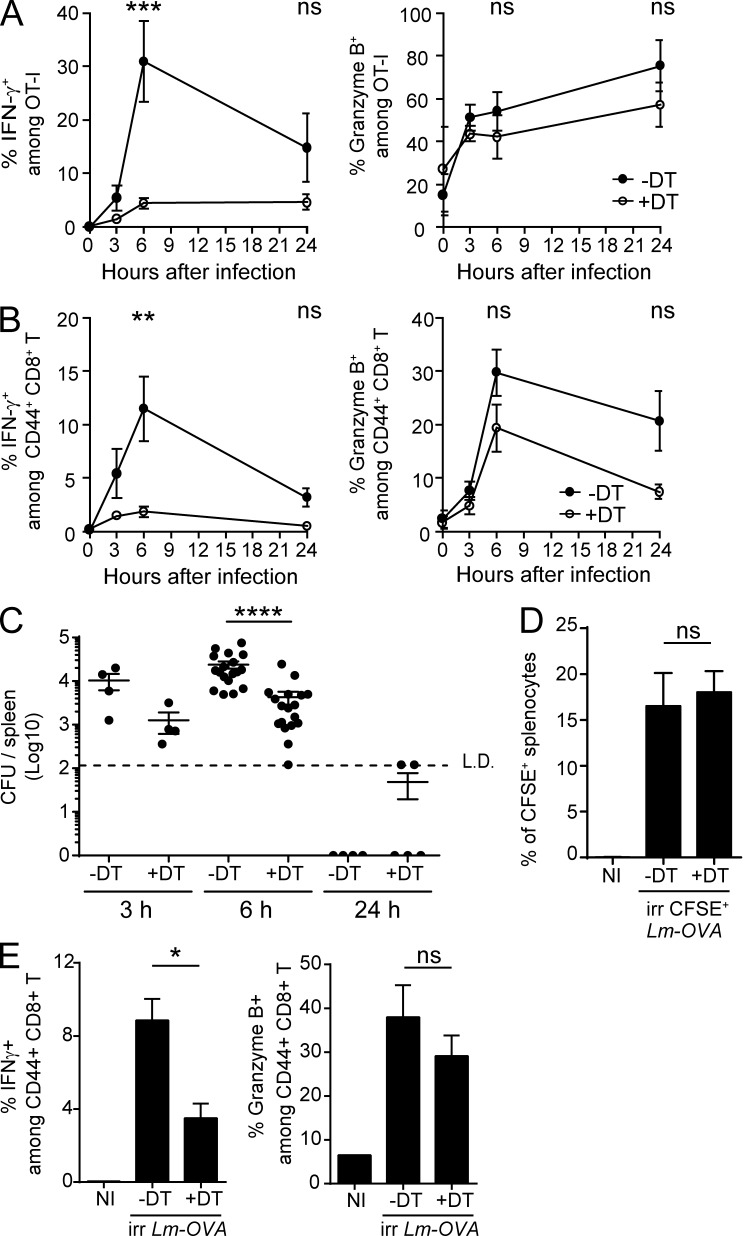
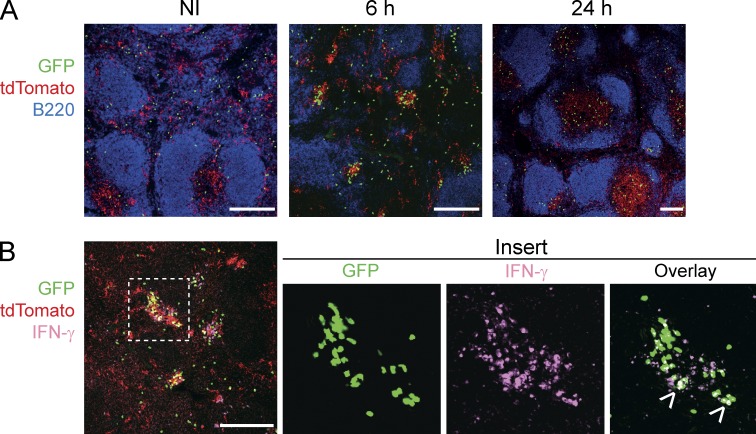
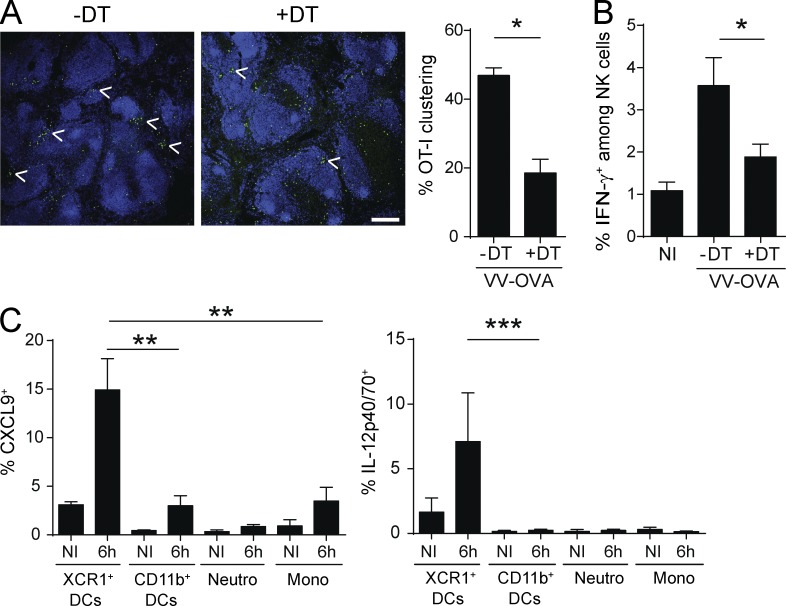
Naive CD8(+) T cell priming during tumor development or many primary infections requires cross-presentation by XCR1(+) dendritic cells (DCs). Memory CD8(+) T lymphocytes (mCTLs) harbor a lower activation threshold as compared with naive cells. However, whether their recall responses depend on XCR1(+) DCs is unknown. By using a new mouse model allowing fluorescent tracking and conditional depletion of XCR1(+) DCs, we demonstrate a differential requirement of these cells for mCTL recall during secondary infections by different pathogens. XCR1(+) DCs were instrumental to promote this function upon secondary challenges with Listeria monocytogenes, vesicular stomatitis virus, or Vaccinia virus, but dispensable in the case of mouse cytomegalovirus. We deciphered how XCR1(+) DCs promote mCTL recall upon secondary infections with Listeria. By visualizing for the first time the in vivo choreography of XCR1(+) DCs, NK cells and mCTLs during secondary immune responses, and by neutralizing in vivo candidate molecules, we demonstrate that, very early after infection, mCTLs are activated, and attracted in a CXCR3-dependent manner, by NK cell-boosted, IL-12-, and CXCL9-producing XCR1(+) DCs. Hence, depending on the infectious agent, strong recall of mCTLs during secondary challenges can require cytokine- and chemokine-dependent cross-talk with XCR1(+) DCs and NK cells.


Figures

Figure 1.
Figure 1.
Expression analysis of the a530099j19rik gene and generation of Karma mice. (A) Microarray analysis of the expression of the a530099j19rik gene in 96 different cell types or tissues in mouse. pDCs (green), CD11b+ (blue), and XCR1+ (red) DCs, spleen (brown), and lymph nodes (yellow) are highlighted among all other cell types and tissues (gray). (B) Schematic representation of the Karma mouse genetic construction. An IRES-tdTomato-2A-DTR cassette was inserted downstream of the stop codon in the 3′ untranslated region of exon 2 of the a530099j19rik gene.
Figure 2.
Figure 2.
In Karma mice, all XCR1+ DCs express the tdTomato, and are specifically and efficiently depleted upon DT administration. (A) Analysis of the tdTomato expression among total splenocytes. After dead cell exclusion, tdTomato-positive cells were analyzed for lineage (CD3ε/CD19/NK1.1), CD11c, SiglecH, XCR1, and CD11b expression. The percentage of cells among the gate is shown. (top) Gating strategy using control splenocytes; (bottom) staining of Karma splenocytes. (B–D) Analysis of tdTomato expression by DCs in spleen (B), epidermis and dermis (C), and CLNs (D) of Karma mice. See Fig. S1 (A–C) for details about the gating strategy used. WT cells (dotted histogram) were included in overlays to set the tdTomato background signal for comparison with Karma cells (black histogram). For the spleen, one experiment representative of at least four with three mice per group is shown. For the skin and CLNs, one representative experiment out of three with three mice per group is shown. (E and F) Specific depletion and recovery of XCR1+ DCs in Karma mice upon DT administration. Splenocytes of DT-injected mice were analyzed by flow cytometry 24 h (E) or several days after treatment (F). The absolute numbers of the analyzed cell population are represented. In these experiments, XCR1+ DCs were gated using CD8α staining in place of XCR1. Data are shown for one experiment representative of two independent ones, with three mice per group. (G) Antigen cross-presentation is abolished in XCR1+ DC-depleted mice. Data are shown for one experiment representative of two with three mice per group. Data are represented as mean ± SEM. **, P < 0.01. (H) IL-12p70 induction is reduced in XCR1+ DC-depleted mice upon STAg administration. The experiment was performed with two noninjected (NI) control mice, and with three STAg-injected mice per condition. Data are represented as mean ± SEM.
Figure 3.
Figure 3.
Splenic XCR1+ DCs promote mCTL responses upon secondary infection with various intracellular pathogens. Memory mice were used 30 d after primary infections. (A) The DT was injected 1 d before, and 1 and 3.5 d after secondary infections with Lm-OVA, MCMV-OVA, VV-OVA, or VSV-OVA. Tetramer-positive cells were measured by flow cytometry 5 d after infections. See Fig. S2 for the detailed gating strategy. Graph shows pooled data (mean ± SEM) from two independent experiments each with two to three mice per group. *, P < 0.05; ns, not significant. NI, noninfected. (B–D) Different protocols of DT treatment were applied as illustrated. DT was injected 1 d before, and 1 and 3.5 d after (B), or 1 d before (C), or 1 and 3.5 d after (D) secondary infection with 106 CFU of Lm-OVA. Splenocytes and blood leukocytes were analyzed by flow cytometry 5 d after infection. IFN-γ, GzmB, and CCL3 induction was measured after in vitro restimulation with SIINFEKL. Data (mean ± SEM) are shown for one experiment representative of two with three to four mice per group (*, P < 0.05; ns, not significant). NI, noninfected. (E) Analysis of IFN-γ and GzmB induction in CD8+ T cells from the spleen of DT-treated memory Karma mice 5 d after secondary challenge, after in vitro restimulation with LLO296-304 peptide. Lm-WT was used for the primary (3 × 10³ CFU) and secondary (106 CFU) infections. The protocol of DT administration applied was the same as in B. See Fig. S2 for the detailed gating strategy. Data (mean ± SEM) are shown for one experiment representative of two with three to four mice per group. *, P < 0.05; ns, not significant. NI, noninfected.
Figure 4.
Figure 4.
XCR1+ DCs promote the early production of IFN-γ by mCTLs. Karma mice received 500–1000 naive GFP+ OT-I cells 1 d before primary infection with Lm-OVA. 30 d later, mice were treated with DT (open circle) or left untreated (black circle), and secondary infected 1 d later with 106 CFU of Lm-OVA. Splenocytes were harvested, incubated with brefeldin A before intracellular staining of IFN-γ and GzmB. Fig. S2B contains details of the gating strategy. (A) Analysis of the activation of OT-I GFP+ mCTLs. ***, P < 0.001. (B) Analysis of IFN-γ and Granzyme B induction in all endogenous polyclonal mCTLs as identified by their CD44hi phenotype. Graph shows pooled data (mean ± SEM) from three independent experiments each with three mice per group. **, P < 0.01. (C) Bacterial load in DT-treated Karma mice after secondary infection with Lm. Enumeration of Lm in spleens of DT-treated and untreated memory Karma mice 3, 6, and 24 h after secondary infection; L.D., limit of detection. Data are represented as mean ± SEM. ****, P < 0.0001. Data at 6 h are pooled from five independent experiments each with at least three mice per group. Data at 3 and 24 h are pooled from two independent experiments each with two to three mice per group. (D and E) Memory DT-treated Karma mice were infected with 108 CFU of UV-C–treated CFSE-stained Lm-OVA. Analysis of CFSE+ splenocytes (D) and of IFN-γ and Granzyme B induction in all polyclonal CD44hi mCTLs in spleens (E) of mice 6 h after secondary infection with UV-C–irradiated bacteria. Data (mean ± SEM) are shown for one experiment representative of two with three to four mice per group. *, P < 0.05; ns, not significant. NI, noninfected.
Figure 5.
Figure 5.
XCR1+ DCs are required for the clustering of mCTLs around the marginal zone, and promote their subsequent migration into the T cell zone. Memory Karma mice were generated as described in Fig. 3. (A) Spleen sections from untreated or DT-treated memory mice were stained with anti-B220 (dark blue) and anti-GFP (green) to define B cell follicles and OT-I mCTLs, respectively, and analyzed by confocal microscopy. Bars, 200 µm. Dotted lines delineate T cell zones. One representative experiment of three, each with three mice per group, is shown. (B) Statistical analysis of the frequency of OT-I mCTLs found clustered around the follicles at 6 h. Graph shows pooled data (mean ± SEM) from three independent experiments each with three mice per group. **, P < 0.01. (C) Statistical analysis of the frequency of OT-I mCTLs present in the T cell zones at 24 h. Graph shows pooled data (mean ± SEM) from two independent experiments each with three mice per group. **, P < 0.01; ns, nonsignificant.
Figure 6.
Figure 6.
RP-associated XCR1+ DCs form clusters around the marginal zone and activate mCTLs. Memory Karma mice were generated as described in Fig. 3. Anti-GFP (green) and anti-dsRed (red) antibodies were used to detect memory OT-I cells and tdTomato+ XCR1+ DCs, respectively, on spleen sections imaged by confocal microscopy. (A) Spleen sections were stained with anti-B220 (dark blue) to define B cell follicles. (B) IFN-γ staining (pink) of spleen sections 6 h after secondary Lm-OVA infection. Overlay of IFN-γ staining with GFP gave a white color (arrows in insert). One representative experiment out of three with three mice per group is shown. Bars, 200 µm.
Figure 7.
Figure 7.
Role of IL-12 and CXCL9 production by XCR1+ DCs in the early recruitment and activation of mCTLs after secondary infection. The induction of IL-12p40/70 (A) and CXCL9 (D) was analyzed by flow cytometry 6 h after Lm-OVA rechallenge in several splenocyte populations (see Fig. S3 for the detailed gating of cells). IL-12p40/70 and CXCL9 were not detected in any other populations than cDC subsets, neutrophils, and monocytes. Intracellular staining was performed directly ex vivo without prior incubation with brefeldin A. Data (mean ± SEM) are shown from one experiment representative of three independent ones, each with at least three mice per group. *, P < 0.05. (B and C) IL-12 neutralization abrogates IFN-γ induction in mCTLs upon secondary infection. Memory mice were treated with IL-12–blocking antibody (anti–IL-12) or isotype control (Isot) 18h before secondary infection. Spleens were harvested at 6 h after secondary Lm-OVA infection. Frequency of OT-I mCTLs (B) and of polyclonal CD44hi mCTLs (C) that produce IFN-γ 6 h post-secondary infection was measured as in Fig. 4. Data (mean ± SEM) are from one experiment with at least four mice per group. *, P < 0.05. (E) Spleen sections of memory Karma mice either noninfected (NI) or infected for 6 h with Lm-OVA (6 h), were stained with anti-CXCL9 (green) and anti-dsRed (red). Merged image shows overlay of anti-CXCL9 with anti-dsRed. Bar, 200 µm. One representative experiment of two, each with two mice per group, is shown. (F–H) Memory mice were treated with CXCR3-blocking antibody (anti-CXCR3) or isotype control (Isot) 18 h before secondary infection. Spleens were harvested at 6 h after secondary Lm-OVA infection, cut in equal halves and processed either for flow cytometry or confocal imaging. Frequency of OT-I mCTLs (F) and of polyclonal CD44hi mCTLs (G) that produce IFN-γ 6 h post-secondary infection was measured as in Fig. 3. (H) Spleen sections were stained with anti-B220 (dark blue) and anti-GFP (green), and analyzed by confocal microscopy. Bar, 500 µm. Arrows show clusters. One representative experiment of three, each with at least three mice per group, is shown. Graph represents percentage of OT-I mCTLs that form clusters in anti–CXCR3-treated memory mice as mathematically determined. Data (mean ± SEM) are pooled from two independent experiments, each including at least three mice per group. *, P < 0.05; **, P < 0.01.
Figure 8.
Figure 8.
The early IFN-γ production participates in the clustering of mCTLs after secondary infection. IFN-γ–blocking antibodies (anti–IFN-γ) or isotype control (Isot) were injected to memory mice 18 h before secondary infection. Spleens were harvested at 6 h after, cut in equal halves, and processed either for flow cytometry or confocal imaging. (A) Frequency of IL-12p40/70 and CXCL9-producing XCR1+ DCs in spleens. (B) Spleen sections were stained for GFP (green) and B220 (dark blue). Bar, 200 µm. Arrows show clusters. Graph represents percentage of OT-I mCTLs that form clusters in anti–IFN-γ-treated memory mice as mathematically determined. Data (mean ± SEM) are shown for one experiment representative of two independent ones, each with at least three mice per group. *, P < 0.05; ns, nonsignificant. (C) Spleens of memory mice were harvested 6 h after secondary infection. Circle diagram encompasses all cells that stained positive for IFN-γ. One representative experiment out of four with three mice per group is shown. (D and E) Spleens from memory mice were fixed 6 h after the infection, and sections were stained with anti-GFP (green), anti-dsRed (red), and anti-NKp46 (cyan; bar, 200 µm; D), or with anti-GFP (green), anti–IFN-γ (red) and anti-NKp46 (cyan; bar, 50 µm; E). One representative experiment out of two, each with three mice per group, is shown. (F-I) Impact of NK cell depletion. (F) Frequency of IL-12p40/70 and CXCL9-producing XCR1+ DCs in spleens 6 h after Lm-OVA secondary infection. Data (mean ± SEM) are pooled from two independent experiments, each with at least three mice per group. *, P < 0.05; **, P < 0.01. (G and H) Frequency of OT-I mCTLs (G) and of polyclonal CD44hi mCTLs (H) that produce IFN-γ 6 h post-secondary infection was measured as in Fig. 3. One experiment representative of three independent ones, each with five mice per group is shown. Data are represented as mean ± SEM. *, P < 0.05. (I) Statistical analysis of clustered OT-I mCTLs. Data (mean ± SEM) are pooled from two independent experiments, each with at least three mice per group.
Figure 9.
Figure 9.
XCR1+ DCs are the major producers of IL-12 and CXCL9, and promote mCTL clustering upon secondary infection with VV-OVA. Karma mice received 500–1,000 naive GFP+ OT-I cells 1 d before primary infection with Lm-OVA. 30 d later, mice were treated with DT or left untreated, and secondary infected with VV-OVA. Spleens were harvested 6 h after secondary challenge. (A) Spleen sections from untreated or DT-treated memory Karma mice were stained with anti-B220 (dark blue) and anti-GFP (green), and analyzed by confocal microscopy. Bar, 200 µm. Statistical analysis of the frequency of OT-I mCTLs found clustered around the follicles. Graph shows data (mean ± SEM) from one representative of two independent experiments each with at least three mice per group. *, P < 0.05. (B) Analysis of IFN-γ induction in NK cells 6 h after VV-OVA secondary challenge. Splenocytes were harvested, incubated with brefeldin A before intracellular staining of IFN-γ. Data (mean ± SEM) are shown from one representative of two independent experiments, each with at least three mice per group. *, P < 0.05. (C) The induction of IL-12p40/70 and CXCL9 was analyzed by flow cytometry in several splenocyte populations (see Fig. S3 for the detailed gating of cells). Intracellular staining was performed directly ex vivo without prior incubation with brefeldin A. Data (mean ± SEM) shown are pooled from two independent experiments, each with at least three mice per group. **, P < 0.01; ***, P < 0.001.

References

    1. Adam C., King S., Allgeier T., Braumüller H., Lüking C., Mysliwietz J., Kriegeskorte A., Busch D.H., Röcken M., and Mocikat R.. 2005. DC-NK cell cross talk as a novel CD4+ T-cell-independent pathway for antitumor CTL induction. Blood. 106:338–344. 10.1182/blood-2004-09-3775 - DOI - PubMed
    1. Aoshi T., Zinselmeyer B.H., Konjufca V., Lynch J.N., Zhang X., Koide Y., and Miller M.J.. 2008. Bacterial entry to the splenic white pulp initiates antigen presentation to CD8+ T cells. Immunity. 29:476–486. 10.1016/j.immuni.2008.06.013 - DOI - PubMed
    1. Bajénoff M., Narni-Mancinelli E., Brau F., and Lauvau G.. 2010. Visualizing early splenic memory CD8+ T cells reactivation against intracellular bacteria in the mouse. PLoS One. 5:e11524 10.1371/journal.pone.0011524 - DOI - PMC - PubMed
    1. Bar-On L., and Jung S.. 2010a Defining dendritic cells by conditional and constitutive cell ablation. Immunol. Rev. 234:76–89. 10.1111/j.0105-2896.2009.00875.x - DOI - PubMed
    1. Bar-On L., and Jung S.. 2010b Defining in vivo dendritic cell functions using CD11c-DTR transgenic mice. Methods Mol. Biol. 595:429–442. 10.1007/978-1-60761-421-0_28 - DOI - PubMed

Publication types

MeSH terms