. 2016 Feb;15(1):155-66.
doi: 10.1111/acel.12425. Epub 2015 Nov 24.

Sex- and tissue-specific changes in mTOR signaling with age in C57BL/6J mice

Affiliations

Sex- and tissue-specific changes in mTOR signaling with age in C57BL/6J mice

Emma L Baar et al. Aging Cell. 2016 Feb.

Abstract

Inhibition of the mTOR (mechanistic Target Of Rapamycin) signaling pathway robustly extends the lifespan of model organisms including mice. The precise molecular mechanisms and physiological effects that underlie the beneficial effects of rapamycin are an exciting area of research. Surprisingly, while some data suggest that mTOR signaling normally increases with age in mice, the effect of age on mTOR signaling has never been comprehensively assessed. Here, we determine the age-associated changes in mTORC1 (mTOR complex 1) and mTORC2 (mTOR complex 2) signaling in the liver, muscle, adipose, and heart of C57BL/6J.Nia mice, the lifespan of which can be extended by rapamycin treatment. We find that the effect of age on several different readouts of mTORC1 and mTORC2 activity varies by tissue and sex in C57BL/6J.Nia mice. Intriguingly, we observed increased mTORC1 activity in the liver and heart tissue of young female mice compared to male mice of the same age. Tissue and substrate-specific results were observed in the livers of HET3 and DBA/2 mouse strains, and in liver, muscle and adipose tissue of F344 rats. Our results demonstrate that aging does not result in increased mTOR signaling in most tissues and suggest that rapamycin does not promote lifespan by reversing or blunting such an effect.

Keywords: aging; mTOR; mTORC1; mTORC2; mice; rapamycin; sexual dimorphism.


Figures

Figure 1
Figure 1
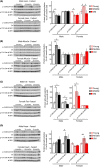
mTORC1 activity in fasted male and female C57BL/6J.Nia mice. (A–D) The phosphorylation of S6 and 4E‐BP1 was assessed by Western blotting of (A) liver, (B) muscle, (C) adipose, and (D) heart tissue lysates. Additional western blots included in the quantification are shown in Fig. S1A. Young refers to 6‐month‐old males and females (10 males, 5 females), Middle refers to 24‐month‐old males and 22‐month‐old females (10 males, 5 females), and Old refers to 30‐month‐old males and 26‐month‐old females (8 males, 4 females). Quantification of S6 S240/S244 is relative to S6, and 4E‐BP1 T37/S46 is relative to 4E‐BP1 (*< 0.05, #< 0.09, two‐tailed t‐test, error bars indicate standard error).
Figure 2
Figure 2
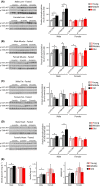
mTORC2 activity in fasted male and female C57BL/6J.Nia mice. (A–D) The phosphorylation of AKT was assessed by Western blotting of (A) liver, (B) muscle, (C) adipose, and (D) heart tissue lysates. Additional western blots included in the quantification are shown in Fig. S1B. Young refers to 6‐month‐old males and females (10 males, 5 females), Middle refers to 24‐month‐old males and 22‐month‐old females (10 males, 5 females), and Old refers to 30‐month‐old males and 26‐month‐old females (8 males, 4 females). Quantification of AKT T308 and S473 are relative to AKT (*< 0.05, #< 0.09, two‐tailed t‐test, error bars indicate standard error). (E) Fasting blood glucose and insulin levels were assessed in Young, Middle and Old male and female mice, and HOMA2‐IR was calculated (males: = 5 Young, 5 Middle, 5 Old; females: = 7 Young, 7 Middle, 6 Old; *= < 0.05, #= 0.054, two‐tailed t‐test).
Figure 3
Figure 3
mTORC1 activity in fed male and female C57BL/6J.Nia mice. (A–D) The phosphorylation of S6K1, S6, and 4E‐BP1 was assessed by Western blotting of (A) liver, (B) muscle, (C) adipose, and (D) heart tissue lysates from mice that were fasted overnight and then refed for 45 min. Additional western blots included in the quantification are shown in Fig. S2A. Young refers to 6‐month‐old males and females (10 males, 5 females), Middle refers to 24‐month‐old males and 22‐month‐old females (10 males, 5 females), and Old refers to 30‐month‐old males and 26‐month‐old females (8 males, 4 females). Quantification of S6K1 T389 is relative to S6K1, S6 S240/S244 is relative to S6, and 4E‐BP1 T37/S46 is relative to 4E‐BP1 (**< 0.01, *< 0.05, #< 0.09, two‐tailed t‐test, error bars indicate standard error).
Figure 4
Figure 4
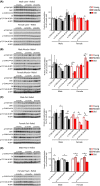
mTORC2 activity in refed male and female C57BL/6J.Nia mice. (A–D) The phosphorylation of AKT was assessed by Western blotting of (A) liver, (B) muscle, (C) adipose, and (D) heart tissue lysates from mice that were fasted overnight and then refed for 45 min. Additional western blots included in the quantification are shown in Fig. S2B. Young refers to 6‐month‐old males and females (10 males, 5 females), Middle refers to 24‐month‐old males and 22‐month‐old females (10 males, 5 females), and Old refers to 30‐month‐old males and 26‐month‐old females (8 males, 4 females). Quantification of AKT T308 and S473 are relative to AKT (**< 0.01, *< 0.05, #< 0.09, two‐tailed t‐test, error bars indicate standard error).
Figure 5
Figure 5
mTOR activity in male and female young C57BL/6J.Nia mice. (A–D) The phosphorylation of S6, 4E‐BP1, and AKT was assessed by Western blotting of (A) liver, (B) muscle, (C) adipose, and (D) heart tissue from mice that were either fasted overnight (Fasted) or fasted overnight and then refed for 45 min (Refed). Additional western blots included in the quantification are shown in Fig. S3. Quantification of S6 S240/S244 is relative to S6, 4E‐BP1 T37/S46 is relative to 4E‐BP1 and AKT S473 is relative to AKT (**< 0.003, *< 0.05, two‐tailed t‐test, error bars indicate standard error).
Figure 6
Figure 6
A heat map summarizing the average fold‐change (log2) in the phosphorylation of specific residues in Middle‐aged (MA) and Old (OA) C57BL/6J.Nia mice vs. Young (6 months old) control mice. A color key is provided to the right of each heat map, numbers indicate the log2 fold‐change relative to the Young (6 months old) mice. (C) One conceptual model (‘Old Model’) is that increasing chronological age induces a pathological increase in mTOR activity, which in turn promotes the pathophysiology of aging. In this model, rapamycin might act to promote lifespan by blocking this age‐associated pathological increase in mTOR signaling. Our findings support a different model (‘New Model’), in which the effect of age on mTOR activity varies by substrate, tissue, and sex, and in which aging does not lead to a generalized increase in mTOR signaling. In this model, rapamycin acts to decrease mTOR signaling generally.

References

    1. An WL, Cowburn RF, Li L, Braak H, Alafuzoff I, Iqbal K, Iqbal IG, Winblad B, Pei JJ (2003) Up‐regulation of phosphorylated/activated p70 S6 kinase and its relationship to neurofibrillary pathology in Alzheimer's disease. Am. J. Pathol. 163, 591–607. - PMC - PubMed
    1. Bar‐Peled L, Chantranupong L, Cherniack AD, Chen WW, Ottina KA, Grabiner BC, Spear ED, Carter SL, Meyerson M, Sabatini DM (2013) A Tumor suppressor complex with GAP activity for the Rag GTPases that signal amino acid sufficiency to mTORC1. Science 340, 1100–1106. - PMC - PubMed
    1. Bjedov I, Toivonen JM, Kerr F, Slack C, Jacobson J, Foley A, Partridge L (2010) Mechanisms of life span extension by rapamycin in the fruit fly Drosophila melanogaster. Cell Metab. 11, 35–46. - PMC - PubMed
    1. Blagosklonny MV (2009) TOR‐driven aging: speeding car without brakes. Cell Cycle 8, 4055–4059. - PubMed
    1. Calhoun C, Shivshankar P, Saker M, Sloane LB, Livi CB, Sharp ZD, Orihuela CJ, Adnot S, White ES, Richardson A, Jourdan Le Saux C (2015) Senescent Cells Contribute to the Physiological Remodeling of Aged Lungs. J. Gerontol. A Biol. Sci. Med. Sci. Jan 7. pii: glu241. [Epub ahead of print] - PMC - PubMed

Publication types