. 2015 Dec 22:16:151.
doi: 10.1186/s12931-015-0313-4.

A decision tree to assess short-term mortality after an emergency department visit for an exacerbation of COPD: a cohort study

Collaborators, Affiliations

A decision tree to assess short-term mortality after an emergency department visit for an exacerbation of COPD: a cohort study

Cristóbal Esteban et al. Respir Res. .

Abstract

Background: Creating an easy-to-use instrument to identify predictors of short-term (30/60-day) mortality after an exacerbation of chronic obstructive pulmonary disease (eCOPD) could help clinicians choose specific measures of medical care to decrease mortality in these patients. The objective of this study was to develop and validate a classification and regression tree (CART) to predict short term mortality among patients evaluated in an emergency department (ED) for an eCOPD.

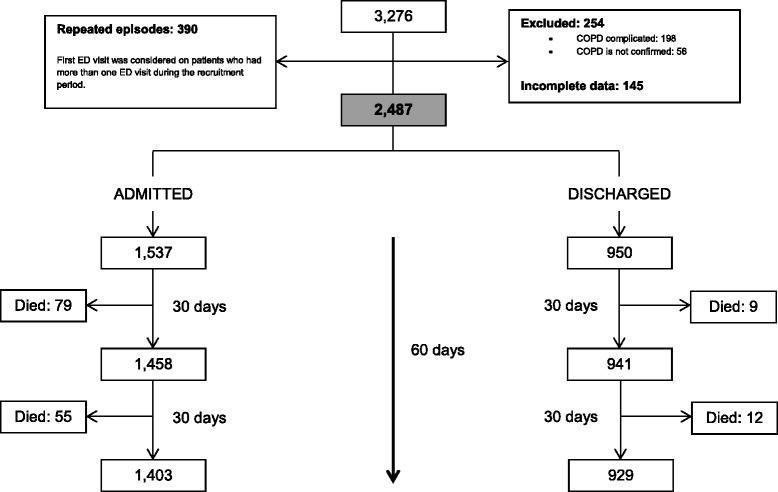
Methods: We conducted a prospective cohort study including participants from 16 hospitals in Spain. COPD patients with an exacerbation attending the emergency department (ED) of any of the hospitals between June 2008 and September 2010 were recruited. Patients were randomly divided into derivation (50%) and validation samples (50%). A CART based on a recursive partitioning algorithm was created in the derivation sample and applied to the validation sample.

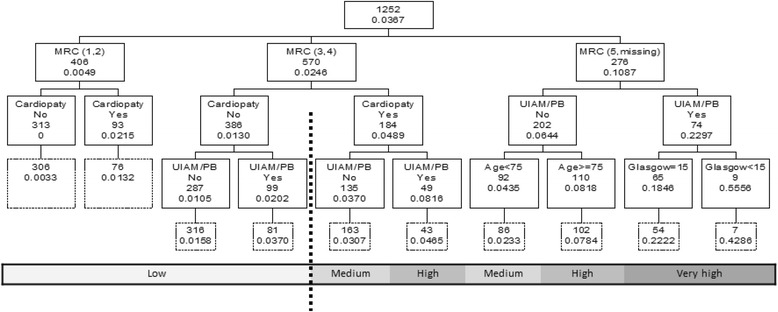
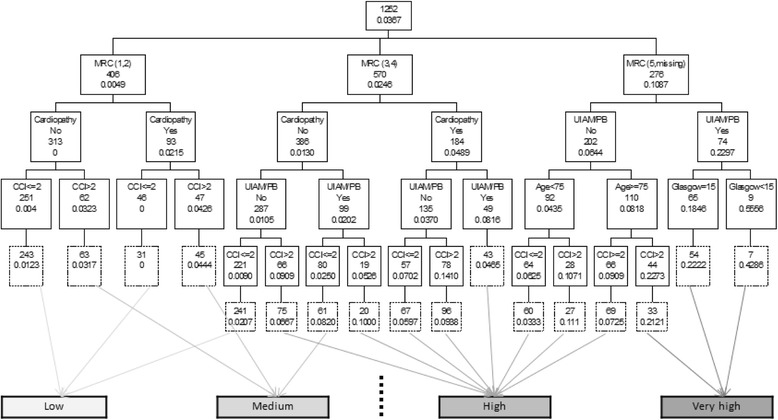
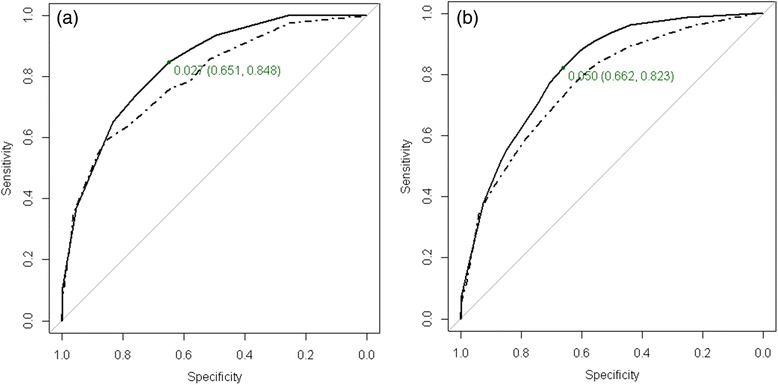
Results: Two thousand four hundred eighty-seven patients, 1252 patients in the derivation sample and 1235 in the validation sample, were enrolled in the study. Based on the results of the univariate analysis, five variables (baseline dyspnea, cardiac disease, the presence of paradoxical breathing or use of accessory inspiratory muscles, age, and Glasgow Coma Scale score) were used to build the CART. Mortality rates 30 days after discharge ranged from 0% to 55% in the five CART classes. The lowest mortality rate was for the branch composed of low baseline dyspnea and lack of cardiac disease. The highest mortality rate was in the branch with the highest baseline dyspnea level, use of accessory inspiratory muscles or paradoxical breathing upon ED arrival, and Glasgow score <15. The area under the receiver-operating curve (AUC) in the derivation sample was 0.835 (95% CI: 0.783, 0.888) and 0.794 (95% CI: 0.723, 0.865) in the validation sample. CART was improved to predict 60-days mortality risk by adding the Charlson Comorbidity Index, reaching an AUC in the derivation sample of 0.817 (95% CI: 0.776, 0.859) and 0.770 (95% CI: 0.716, 0.823) in the validation sample.

Conclusions: We identified several easy-to-determine variables that allow clinicians to classify eCOPD patients by short term mortality risk, which can provide useful information for establishing appropriate clinical care.

Trial registration: NCT02434536.


Figures

Fig. 1
Fig. 1
Flow-chart of the sample
Fig. 2
Fig. 2
Results of the CART analysis for 30-day mortality in the derivation sample. Application to the validation sample is shown below each node in dashed boxes. Each node shows the classification variable plus the number of subjects and the estimated probability of 30-day mortality on that node. Estimated one-month mortality risk has been categorized in low, medium, high and very high as show below the tree. Dashed vertical line shows the cut-off point for dichotomization of estimated mortality risk looking for optimal sensitivity-specificity combination in the derivation sample, leading to a sensitivity of 0.651 and a specificity of 0.848. UIAM = Use of inspiratory accessory muscle; PB = Paradoxical breathing; MRC = MRC breathlessness scale
Fig. 3
Fig. 3
CART model for 60-day mortality in the derivation sample. Application to the validation sample is shown below each node in dashed boxes. Each node shows the classification variable plus the number of subjects and the estimated probability of 60-day mortality on that node. Estimated 60-day mortality risk has been categorized in low, medium, high and very high as show below the tree. Dashed vertical line shows the cut-off point for dichotomization of estimated mortality risk looking for optimal sensitivity-specificity combination in the derivation sample, leading to a sensitivity of 0.662 and a specificity of 0.823. UIAM = Use of inspiratory accessory muscle; PB = Paradoxical breathing; MRC = MRC breathlessness scale; CCI = Charlson Comorbidity Index
Fig. 4
Fig. 4
Roc curve for risk 30-day (a) and 60-day (b) mortality predicted by the CART analyses. Solid line applies for derivation sample and dashed line applies for validation sample. The cut-off point of estimated risk dichotomization for optimal sensitivity-specificity combination for derivation sample is shown in grey with the corresponding sensitivity and specificity values. a 30-day mortality: AUC = 0.835 and 95 % confidence interval is (0.783, 0.888) for derivation sample and AUC = 0.794 and 95 % confidence interval is (0.723, 0.865) for validation sample. b 60-day mortality: AUC = 0.817 and 95 % confidence interval is (0.776, 0.859) for derivation sample and AUC = 0.770 and 95 % confidence interval is (0.716, 0.823) for validation sample

References

    1. Steer J, Gibson GJ, Bourke SC. Predicting outcomes following hospitalization for acute exacerbations of COPD. QJM. 2010;103:817–829. doi: 10.1093/qjmed/hcq126. - DOI - PubMed
    1. Singanayagam A, Schembri S, Chalmers JD. Predictors of mortality in hospitalized adults with acute exacerbation of chronic obstructive pulmonary disease. Ann Am Thorac Soc. 2013;10:81–89. doi: 10.1513/AnnalsATS.201208-043OC. - DOI - PubMed
    1. Kaji AH, Hanif AM, Bosson N, Ostermayer D, Niemann JT. Predictors of Neurologic Outcome in Patients Resuscitated from Out-of-Hospital Cardiac Arrest Using Classification and Regression Tree Analysis. Am J Cardiol. 2014;114:1024–1028. doi: 10.1016/j.amjcard.2014.06.031. - DOI - PubMed
    1. Pouliakis A, Margari C, Margari N, Chrelias C, Zygouris D, Meristoudis C, et al. Using classification and regression trees, liquid-based cytology and nuclear morphometry for the discrimination of endometrial lesions. Diagn Cytopathol. 2014;42:582–591. doi: 10.1002/dc.23077. - DOI - PubMed
    1. Esteban C, Arostegui I, Moraza J, Aburto M, Quintana JM, Pérez-Izquierdo J, et al. Development of a decision tree to assess the severity and prognosis of stable COPD. Eur Respir J. 2011;38:1294–1300. doi: 10.1183/09031936.00189010. - DOI - PubMed

Publication types

MeSH terms

Associated data