. 2015 Dec 22;10(12):e0145456.
doi: 10.1371/journal.pone.0145456. eCollection 2015.

Nutrigenomic and Nutritional Analyses Reveal the Effects of Pelleted Feeds on Asian Seabass (Lates calcarifer)

Affiliations

Nutrigenomic and Nutritional Analyses Reveal the Effects of Pelleted Feeds on Asian Seabass (Lates calcarifer)

Si Yan Ngoh et al. PLoS One. .

Abstract

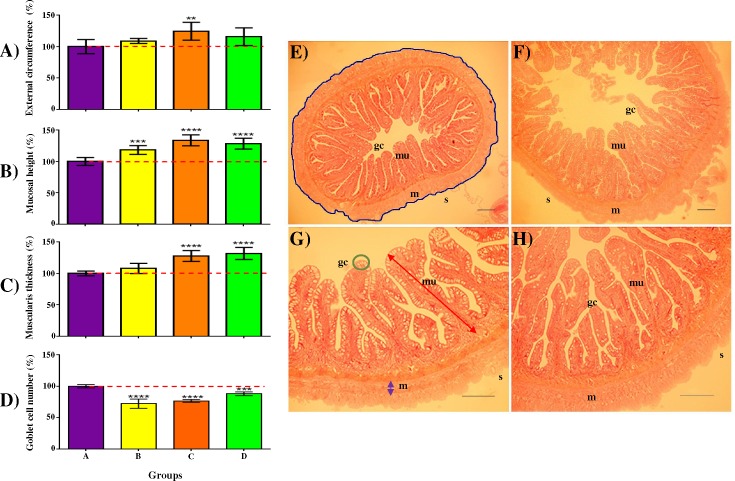
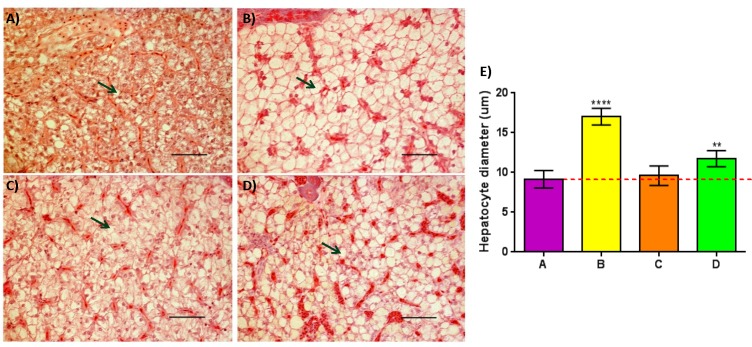
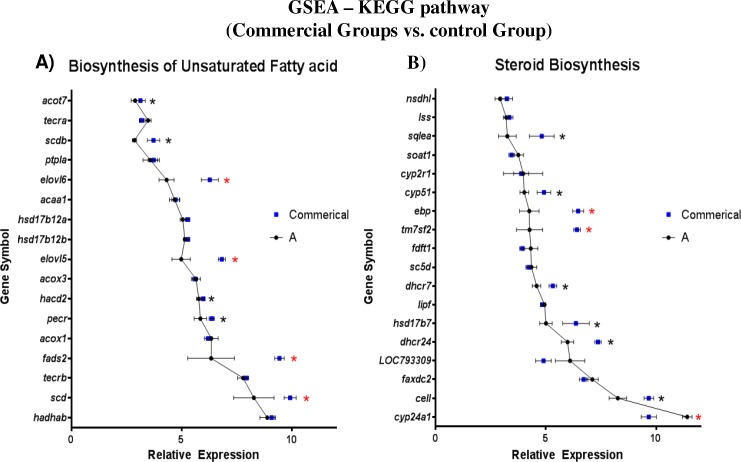
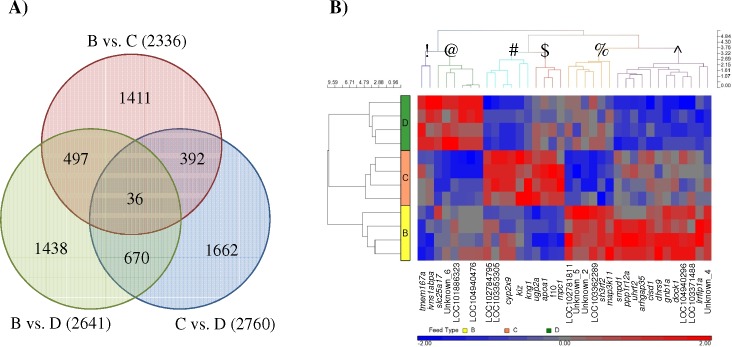
As nutrition-related expenses constitute the majority of the costs for aquaculture farms, it is essential for them to use feeds that provide an ideal combination of nutrients for the species of choice. In this study, the relative effect of consuming three different pelleted feeds (B, C and D) in comparison to frozen baitfish (A; control) were compared on juvenile Asian seabass (77.3 ± 22.4g) that were selected for increased growth rate over two generations. Our objectives were: 1) to evaluate the effects of different pelleted feeds based on overall physiological changes and nutritional quality of fillets; 2) improve our understanding of the underlying mechanisms with transcriptomic analysis; 3) if possible, identify the feed type that supports the growth of these fishes without substantially reducing the nutritional quality of fillet. The growth performance, fatty acid composition of fillet, hepatic histology and transcriptome of the fishes (Groups A-D) were analyzed. The majority of fatty acids of the fillets, except γ-linolenic acid (GLA, C18:3n6), correlated significantly with the respective diets. Asian seabass fed Feed C showed highest specific growth rate (SGR) and feed conversion efficiency (FCE) with closest histology and transcriptomic profile to control, but their fillet contained the highest n6/n3 ratio. When the liver-based transcriptomes were analyzed, a complex set of differentially expressed genes were detected between groups fed pelleted feeds and controls as well as among the pellet-fed groups themselves. Significant enrichment of genes with growth-related function tallied with the morphological data measured. When compared with control (Group A), 'Biosynthesis of unsaturated fatty acids' and 'Steroid biosynthesis' pathways were significantly enriched in pellet-fed groups. Reduced goblet cell numbers were observed in the gut of pellet-fed fish compared to controls and fads6 was found to be a suitable candidate gene to separate wild-caught Asian seabass, from pellet-fed ones. These results provide insights for researchers on the various effects of feeds on the biochemistry and global gene expression of the fish and potentially for seabass farms to make more informed feed choices.


Conflict of interest statement

Competing Interests: The authors have declared that no competing interests exist.

Figures

Fig 1
Fig 1. Schematic overview of the experimental design.
Five large tanks containing six individual canvases of two metric ton volume each per tank were set up. Asian seabass siblings (103 dph) from a pairwise cross performed with two brooders selected for increased growth rate were tagged, measured, photographed and placed into the canvases at 75 individuals per canvas initial density. Following a short adaptation period, frozen baitfish (Feed A, control) and five commercial pelleted growout feeds (Feed B-F) were fed to their respective groups at an average body weight (BW)/day for 61 days; Group A: 6.1%; Group B, C, D, E: 2.2%; Group F: 1.8%. The amount of feed was adjusted on a weekly basis based on BW measurements of 15 individuals per canvas. At 139 dph, all the fish were measured and 25 individuals were randomly removed to reduce density. During the 147–151 dph period, gradual change in pellet size fed to fishes in groups B, C, D and F. At the end of the experiment all individuals were measured and photographed and samples were collected for the different analyses. [Only fish from Groups A-D were subjected to detailed analysis, whereas the other two groups (E&F) were excluded due to technical reasons.]
Fig 2
Fig 2. Wide-ranging differences among the relative body weight gains in Asian seabass fed pelleted feeds compared to control.
Total percentage of body weight gain after the consumption of three different pelleted feeds (Feeds B-D) relative to frozen baitfish (Feed A) during a two-month period (107–168 days post-hatch). Post-ANOVA Tukey's multiple comparison test was performed to compare the mean values of every group. Error bars are plotted with 95% confidence intervals from the mean. Significantly different means are noted with *—Padj < 0.05; **—Padj < 0.01; ***—Padj < 0.001; and ****—Padj < 0.0001.
Fig 3
Fig 3. Formation of unique clusters of fillet fatty acid profile after consuming different pelleted feeds (Feed B-D) and frozen baitfish (Feed A).
The PCA plot generated by Partek® Genomic Suite (v6.6) is based on covariance matrix of 21 fatty acids (area % of total fatty acids) per sample. Coloured balls represent individual samples fed with different feed types.
Fig 4
Fig 4. Positive correlation of fatty acids between fillets of groups and their respective feeds.
Only area % of TFA of large-sized pelleted feeds were used for correlation. Pearson’s correlation coefficient (r) was used to determine the correlation relationship. TFA = Total Fatty Acids.
Fig 5
Fig 5. The gastrointestinal tract of Asian seabass is influenced by the different feeds.
External circumference of serosa (Panel A), mucosal height (Panel B), muscularis layer thickness (Panel C) and goblet cell number (Panel D) were measured from sections of the mid gut of 168 dph-old Asian seabass fed frozen baitfish (Group A) or pelleted commercial feeds (Groups B-D) for 61 days. Values are represented as percentages over control (A) value. Post ANOVA Dunnett’s multiple comparisons test was performed between the mean of each group with the mean of the control group. Means significantly different from Group A are noted with *—Padj < 0.05; **—Padj < 0.01; ***—Padj < 0.001; or ****—Padj < 0.0001. Representative examples of the mid-gut histological sections are shown on the right (Panels E&G–Group A; F&H–Group C). Panel E: Blue line = External circumference of serosa (S); Panel G: red = high of Mucosa (mu), purple = Thickness of muscularis layer (m), green = Goblet cells (gc); Panels E&F - 5x magnification; Panels G&H - 10x magnification. Panels E&H; scale bar = 100μm.
Fig 6
Fig 6. Increased lipid deposition observed in two of the three pellet-fed groups compared to controls with the exception of Group C.
Panel (A-D): cross sections of posterior liver stained with H/E of Groups (A-D) respectively; Green arrows = hepatocytes containing lipid droplet. Panel (a-d); 40x magnification, scale bar = 50μm. Panel E: Quantitative analysis of mean hepatocyte diameter detected within Groups (A-D); Post ANOVA Dunnett’s multiple comparisons test was performed between the mean of each group with the mean of the control group. Means significantly different from Group A are noted with (*—Padj < 0.05; **—Padj < 0.01; ***—Padj < 0.001; ****—Padj < 0.0001).
Fig 7
Fig 7. Gene Set Enrichment Analysis (GSEA) of KEGG pathway comparing pellet-fed groups (B, C and D) against baitfish-fed control (Group A).
By using Danio rerio as reference model, (A) genes that are involved in Biosynthesis of Unsaturated fatty acid pathway, (B) genes that are involved in steroid biosynthesis pathway were compared. Significantly enriched genes are noted with *—P < 0.05. Out of those *, genes that are differentially expressed as well are marked with *—Pfdr < 0.05. Error bars are mean ± SEM.
Fig 8
Fig 8. Different sets of significantly expressed transcripts (SETs) with limited overlaps were found when the liver-derived transcriptome of pellet-fed groups (B-D) were compared.
(A) Venn diagram showing 36 SETs uniformly different in all three commercial vs. commercial feed comparisons. (B) Heatmap showing the complexity of hepatic expression caused by having different dietary intake. Different clusters of genes are represented by symbols (!, @, #, $, %, ^).
Fig 9
Fig 9. Gene ontology enrichment of significantly up-regulated transcripts between the commercial groups (B-D).
Significantly up-regulated transcripts of were analyzed by singular enrichment analysis (agriGO). Results of individual comparisons were presented in a three by three plot. Out of the many ‘Biological Processes’ found to be significantly enriched, those related to metabolism and growth were highlighted and compared upon.

Similar articles

Cited by

References

    1. Statistics and Information Branch of the Fisheries and Aquaculture Department. FAO yearbook. Fishery and Aquaculture Statistics. 2011. Rome: 2013. Accessed: 27 Feb 2014.
    1. Greenwood PH. A Review of the Family Centropomidae (Pisces, Perciformes): British Museum (Natural History); 1976. 81 p.
    1. Cultured Aquatic Species Information Programme. Lates calcarifer Cultured Aquatic Species Information Programme. Text by Rimmer, M.A. In: FAO Fisheries and Aquaculture Department. Rome. Updated 3 June 2006. Available: http://www.fao.org/fishery/culturedspecies/Lates_calcarifer/en 2014. Accessed 27 February 2014.
    1. Ravi P, Jiang J, Liew WC, Orban L. Small-scale transcriptomics reveals differences among gonadal stages in Asian seabass (Lates calcarifer). Reproductive Biology and Endocrinology. 2014;12: 5 10.1186/1477-7827-12-5 - DOI - PMC - PubMed
    1. Wang CM, Lo LC, Zhu ZY, Lin G, Feng F, Li J, et al. Estimating reproductive success of brooders and heritability of growth traits in Asian sea bass (Lates calcarifer) using microsatellites. Aquacult Res. 2008;39(15): 1612–9.

Publication types