

Burst Firing in a Motion-Sensitive Neural Pathway Correlates with Expansion Properties of Looming Objects that Evoke Avoidance Behaviors
- PMID: 26696845
- PMCID: PMC4677101
- DOI: 10.3389/fnint.2015.00060
Burst Firing in a Motion-Sensitive Neural Pathway Correlates with Expansion Properties of Looming Objects that Evoke Avoidance Behaviors
Abstract
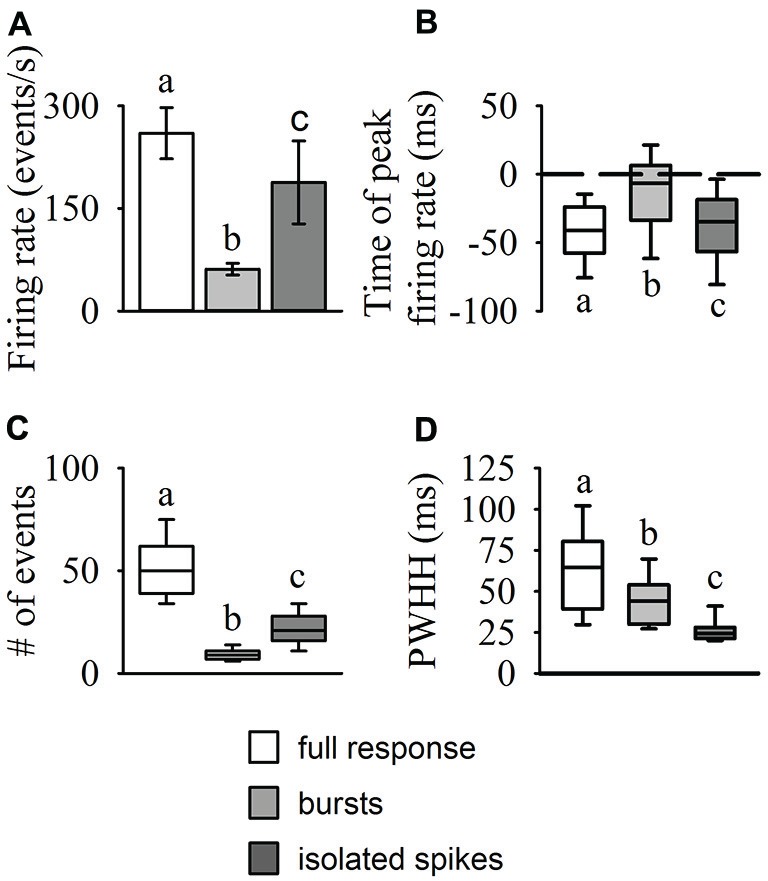
The locust visual system contains a well-defined motion-sensitive pathway that transfers visual input to motor centers involved in predator evasion and collision avoidance. One interneuron in this pathway, the descending contralateral movement detector (DCMD), is typically described as using rate coding; edge expansion of approaching objects causes an increased rate of neuronal firing that peaks after a certain retinal threshold angle is exceeded. However, evidence of intrinsic DCMD bursting properties combined with observable oscillations in mean firing rates and tight clustering of spikes in raw traces, suggest that bursting may be important for motion detection. Sensory neuron bursting provides important timing information about dynamic stimuli in many model systems, yet no studies have rigorously investigated if bursting occurs in the locust DCMD during object approach. We presented repetitions of 30 looming stimuli known to generate behavioral responses to each of 20 locusts in order to identify and quantify putative bursting activity in the DCMD. Overall, we found a bimodal distribution of inter-spike intervals (ISI) with peaks of more frequent and shorter ISIs occurring from 1-8 ms and longer less frequent ISIs occurring from 40-50 ms. Subsequent analysis identified bursts and isolated single spikes from the responses. Bursting frequency increased in the latter phase of an approach and peaked at the time of collision, while isolated spiking was predominant during the beginning of stimulus approach. We also found that the majority of inter-burst intervals (IBIs) occurred at 40-50 ms (or 20-25 bursts/s). Bursting also occurred across varied stimulus parameters and suggests that burst timing may be a key component of looming detection. Our findings suggest that the DCMD uses two modes of coding to transmit information about looming stimuli and that these modes change dynamically with a changing stimulus at a behaviorally-relevant time.
Keywords: DCMD; bursting; locust; neuron; sensory coding; vision.
Figures


Similar articles
-
Background visual motion affects responses of an insect motion-sensitive neuron to objects deviating from a collision course.Physiol Rep. 2016 May;4(10):e12801. doi: 10.14814/phy2.12801. Physiol Rep. 2016. PMID: 27207786 Free PMC article.
-
Background complexity affects response of a looming-sensitive neuron to object motion.J Neurophysiol. 2015 Jan 1;113(1):218-31. doi: 10.1152/jn.00478.2014. Epub 2014 Oct 1. J Neurophysiol. 2015. PMID: 25274344
-
Commentary: Burst Firing in a Motion-Sensitive Neural Pathway Correlates with Expansion Properties of Looming Objects That Evoke Avoidance Behaviors.Front Integr Neurosci. 2016 Jan 11;9:68. doi: 10.3389/fnint.2015.00068. eCollection 2015. Front Integr Neurosci. 2016. PMID: 26793074 Free PMC article. No abstract available.
-
Escapes with and without preparation: the neuroethology of visual startle in locusts.J Insect Physiol. 2010 Aug;56(8):876-83. doi: 10.1016/j.jinsphys.2010.04.015. Epub 2010 May 5. J Insect Physiol. 2010. PMID: 20433843 Review.
-
Oscillatory Bursting as a Mechanism for Temporal Coupling and Information Coding.Front Comput Neurosci. 2020 Sep 15;14:82. doi: 10.3389/fncom.2020.00082. eCollection 2020. Front Comput Neurosci. 2020. PMID: 33071765 Free PMC article. Review.
Cited by
-
Octopamine stabilizes conduction reliability of an unmyelinated axon during hypoxic stress.J Neurophysiol. 2016 Sep 1;116(3):949-59. doi: 10.1152/jn.00354.2016. Epub 2016 Jun 8. J Neurophysiol. 2016. PMID: 27281750 Free PMC article.
-
M current regulates firing mode and spike reliability in a collision-detecting neuron.J Neurophysiol. 2018 Oct 1;120(4):1753-1764. doi: 10.1152/jn.00363.2018. Epub 2018 Jul 25. J Neurophysiol. 2018. PMID: 30044671 Free PMC article.
-
Background visual motion affects responses of an insect motion-sensitive neuron to objects deviating from a collision course.Physiol Rep. 2016 May;4(10):e12801. doi: 10.14814/phy2.12801. Physiol Rep. 2016. PMID: 27207786 Free PMC article.
-
Neonicotinoid and sulfoximine pesticides differentially impair insect escape behavior and motion detection.Proc Natl Acad Sci U S A. 2020 Mar 10;117(10):5510-5515. doi: 10.1073/pnas.1916432117. Epub 2020 Feb 24. Proc Natl Acad Sci U S A. 2020. PMID: 32094166 Free PMC article.
-
Active membrane conductances and morphology of a collision detection neuron broaden its impedance profile and improve discrimination of input synchrony.J Neurophysiol. 2019 Aug 1;122(2):691-706. doi: 10.1152/jn.00048.2019. Epub 2019 Jul 3. J Neurophysiol. 2019. PMID: 31268830 Free PMC article.
References
-
- Baker P. S., Gewecke M., Cooter R. J. (1981). The natural flight of the migratory locust, Locusta migratoria L. J. Comp. Physiol. 141, 233–237. 10.1007/bf01342669 - DOI
-
- Burrows M., Rowell C. H. F. (1973). Connections between descending visual interneurons and metathoracic motoneurons in the locust. J. Comp. Physiol. A 85, 221–234. 10.1007/bf00694231 - DOI
-
- Chen L., Deng Y., Weihua L., Wang Z., Zeng S. (2009). Detection of bursts in neuronal spike trains by the mean inter-spike interval method. Prog. Nat. Sci. 19, 229–235. 10.1016/j.pnsc.2008.05.027 - DOI
LinkOut - more resources
Full Text Sources
Other Literature Sources