

The Effects of Electrical and Optical Stimulation of Midbrain Dopaminergic Neurons on Rat 50-kHz Ultrasonic Vocalizations
- PMID: 26696851
- PMCID: PMC4672056
- DOI: 10.3389/fnbeh.2015.00331
The Effects of Electrical and Optical Stimulation of Midbrain Dopaminergic Neurons on Rat 50-kHz Ultrasonic Vocalizations
Abstract
Rationale: Adult rats emit ultrasonic vocalizations (USVs) at around 50-kHz; these commonly occur in contexts that putatively engender positive affect. While several reports indicate that dopaminergic (DAergic) transmission plays a role in the emission of 50-kHz calls, the pharmacological evidence is mixed. Different modes of dopamine (DA) release (i.e., tonic and phasic) could potentially explain this discrepancy.
Objective: To investigate the potential role of phasic DA release in 50-kHz call emission.
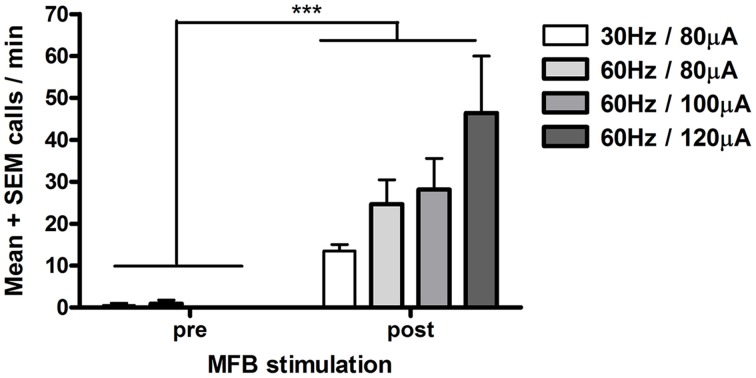
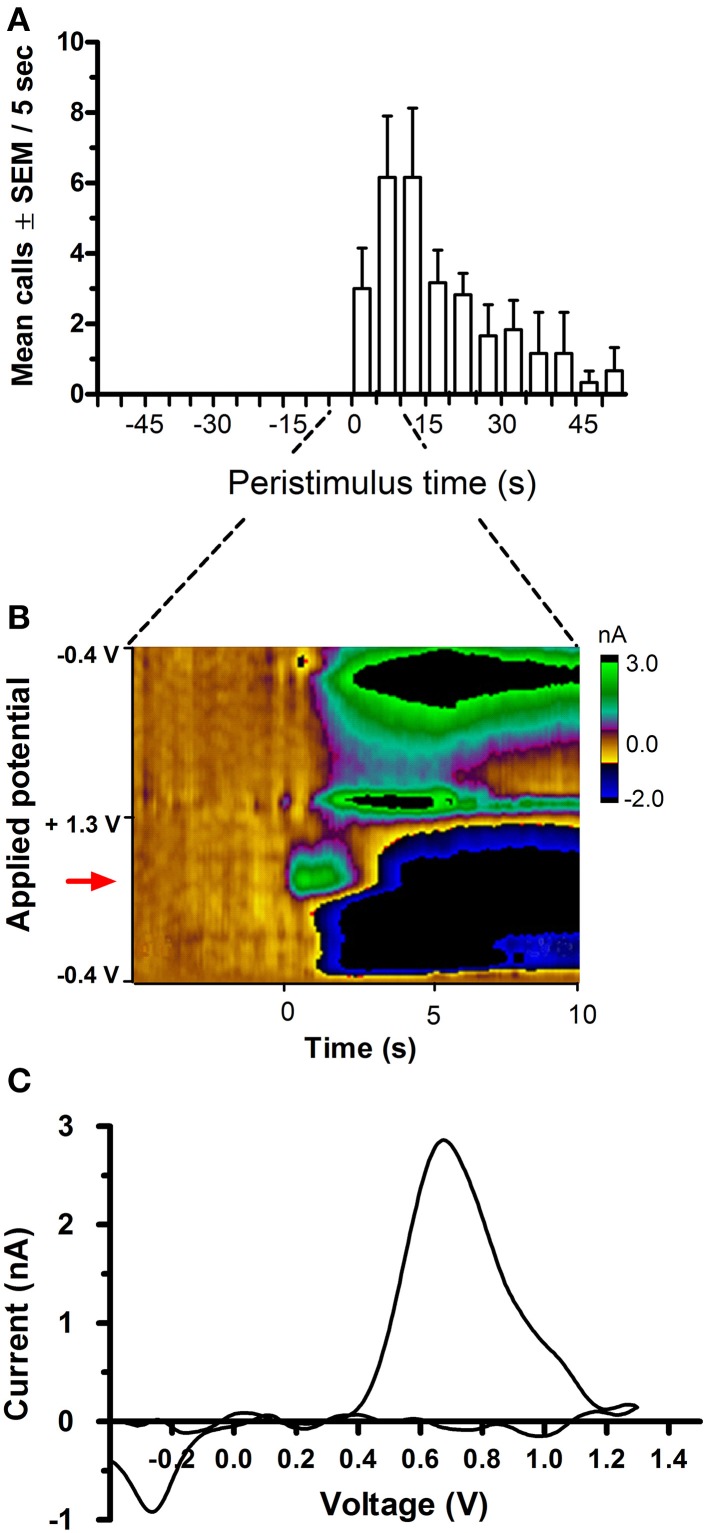
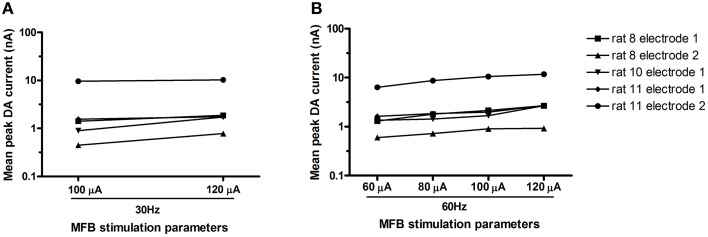
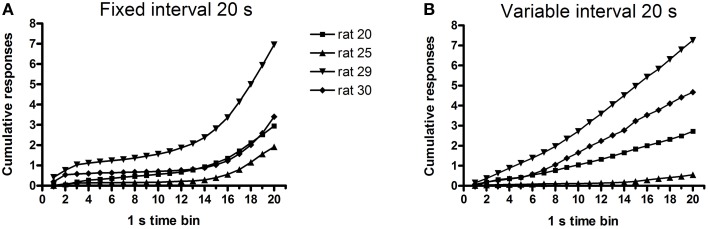
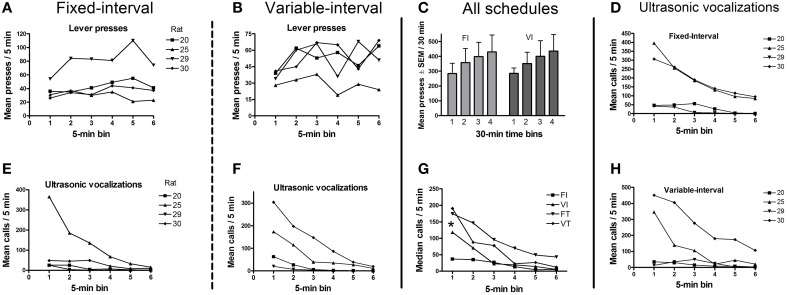
Methods: In Experiment 1, USVs were recorded in adult male rats following unexpected electrical stimulation of the medial forebrain bundle (MFB). In parallel, phasic DA release in the nucleus accumbens (NAcc) was recorded using fast-scan cyclic voltammetry. In Experiment 2, USVs were recorded following response-contingent or non-contingent optogenetic stimulation of midbrain DAergic neurons. Four 20-s schedules of optogenetic stimulation were used: fixed-interval, fixed-time, variable-interval, and variable-time.
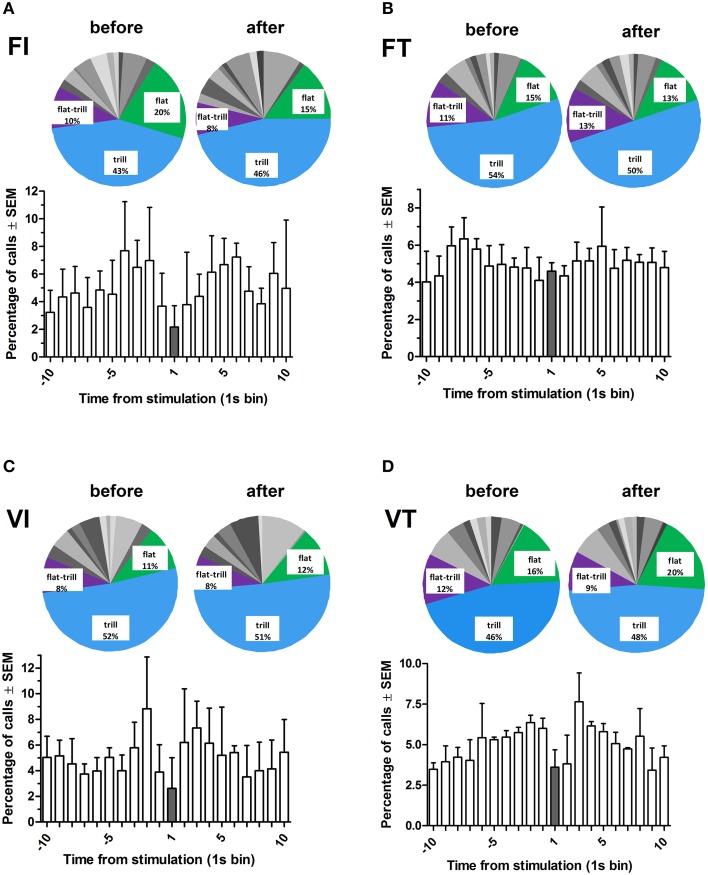
Results: Brief electrical stimulation of the MFB increased both 50-kHz call rate and phasic DA release in the NAcc. During optogenetic stimulation sessions, rats initially called at a high rate comparable to that observed following reinforcers such as psychostimulants. Although optogenetic stimulation maintained reinforced responding throughout the 2-h session, the call rate declined to near zero within the first 30 min. The trill call subtype predominated following both electrical and optical stimulation.
Conclusion: The occurrence of electrically-evoked 50-kHz calls, time-locked to phasic DA (Experiment 1), provides correlational evidence supporting a role for phasic DA in USV production. However, in Experiment 2, the temporal dissociation between calling and optogenetic stimulation of midbrain DAergic neurons suggests that phasic mesolimbic DA release is not sufficient to produce 50-kHz calls. The emission of the trill subtype of 50-kHz calls potentially provides a marker distinguishing positive affect from positive reinforcement.
Keywords: fast-scan cyclic voltammetry; midbrain dopaminergic neurons; nucleus accumbens; optogenetics; phasic dopamine; ultrasonic vocalizations.
Figures
Similar articles
-
Phasic dopamine release in the nucleus accumbens in response to pro-social 50 kHz ultrasonic vocalizations in rats.J Neurosci. 2014 Aug 6;34(32):10616-23. doi: 10.1523/JNEUROSCI.1060-14.2014. J Neurosci. 2014. PMID: 25100595 Free PMC article.
-
Intracerebral injection of R-(-)-Apomorphine into the nucleus accumbens decreased carbachol-induced 22-kHz ultrasonic vocalizations in rats.Behav Brain Res. 2019 May 17;364:264-273. doi: 10.1016/j.bbr.2019.01.044. Epub 2019 Jan 26. Behav Brain Res. 2019. PMID: 30690109
-
Effect of temporal interference electrical stimulation on phasic dopamine release in the striatum.Brain Stimul. 2023 Sep-Oct;16(5):1377-1383. doi: 10.1016/j.brs.2023.09.012. Epub 2023 Sep 15. Brain Stimul. 2023. PMID: 37716638
-
Rat 50-kHz ultrasonic vocalizations as a tool in studying neurochemical mechanisms that regulate positive emotional states.J Neurosci Methods. 2018 Dec 1;310:33-44. doi: 10.1016/j.jneumeth.2018.06.018. Epub 2018 Jun 26. J Neurosci Methods. 2018. PMID: 29959002 Review.
-
Environmental and Pharmacological Modulation of Amphetamine- Induced 50-kHz Ultrasonic Vocalizations in Rats.Curr Neuropharmacol. 2015;13(2):220-32. doi: 10.2174/1570159x1302150525124408. Curr Neuropharmacol. 2015. PMID: 26411764 Free PMC article. Review.
Cited by
-
Increased self-triggered vocalizations in an epidermal growth factor-induced rat model for schizophrenia.Sci Rep. 2022 Jul 28;12(1):12917. doi: 10.1038/s41598-022-17174-3. Sci Rep. 2022. PMID: 35902695 Free PMC article.
-
Role of hypocretin/orexin receptor blockade on drug-taking and ultrasonic vocalizations (USVs) associated with low-effort self-administration of cathinone-derived 3,4-methylenedioxypyrovalerone (MDPV) in rats.Psychopharmacology (Berl). 2017 Nov;234(21):3207-3215. doi: 10.1007/s00213-017-4709-3. Epub 2017 Aug 7. Psychopharmacology (Berl). 2017. PMID: 28786030 Free PMC article.
-
Stereoselective Differences between the Reinforcing and Motivational Effects of Cathinone-Derived 4-Methylmethcathinone (Mephedrone) In Self-Administering Rats.ACS Chem Neurosci. 2017 Dec 20;8(12):2648-2654. doi: 10.1021/acschemneuro.7b00212. Epub 2017 Sep 22. ACS Chem Neurosci. 2017. PMID: 28885007 Free PMC article.
-
AUTS2 Governs Cerebellar Development, Purkinje Cell Maturation, Motor Function and Social Communication.iScience. 2020 Nov 18;23(12):101820. doi: 10.1016/j.isci.2020.101820. eCollection 2020 Dec 18. iScience. 2020. PMID: 33305180 Free PMC article.
-
Mapping trait-like socio-affective phenotypes in rats through 50-kHz ultrasonic vocalizations.Psychopharmacology (Berl). 2018 Jan;235(1):83-98. doi: 10.1007/s00213-017-4746-y. Epub 2017 Oct 3. Psychopharmacology (Berl). 2018. PMID: 28971233
References
-
- Ahrens A. M., Nobile C. W., Page L. E., Maier E. Y., Duvauchelle C. L., Schallert T. (2013). Individual differences in the conditioned and unconditioned rat 50-kHz ultrasonic vocalizations elicited by repeated amphetamine exposure. Psychopharmacology (Berl) 229, 687–700. 10.1007/s00213-013-3130-9 - DOI - PMC - PubMed
LinkOut - more resources
Full Text Sources
Other Literature Sources
Miscellaneous