

Changes in the Spinal Neural Circuits are Dependent on the Movement Speed of the Visuomotor Task
- PMID: 26696873
- PMCID: PMC4678204
- DOI: 10.3389/fnhum.2015.00667
Changes in the Spinal Neural Circuits are Dependent on the Movement Speed of the Visuomotor Task
Abstract
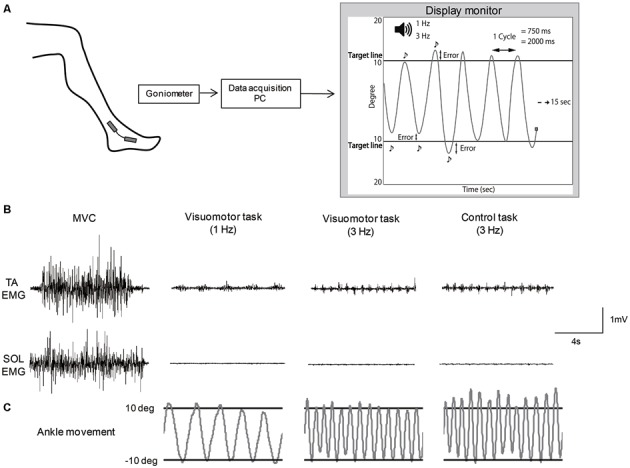
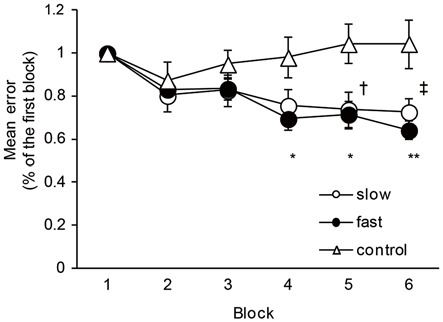
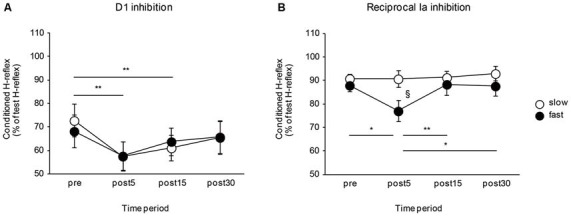
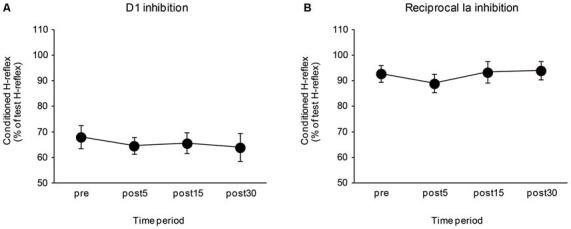
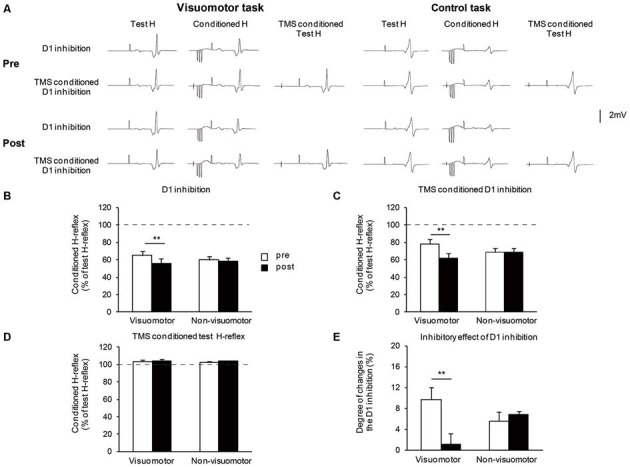
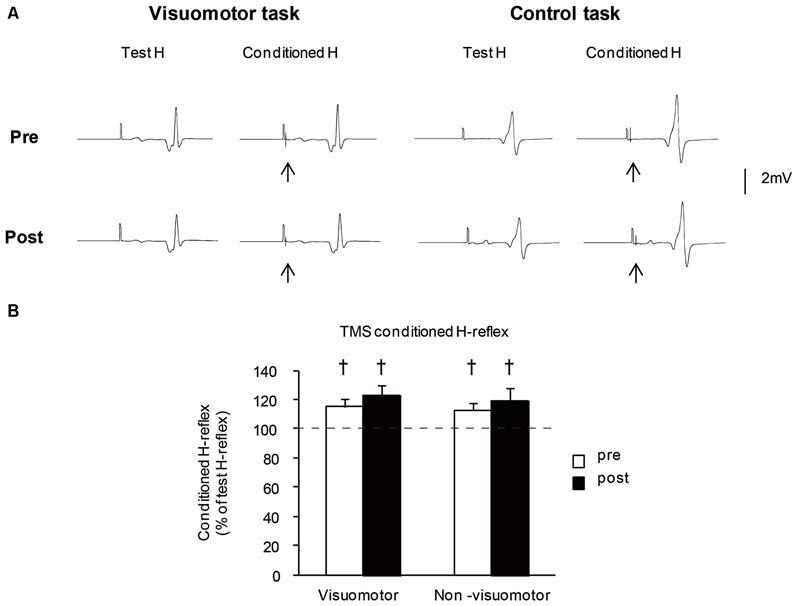
Previous studies have shown that spinal neural circuits are modulated by motor skill training. However, the effects of task movement speed on changes in spinal neural circuits have not been clarified. The aim of this research was to investigate whether spinal neural circuits were affected by task movement speed. Thirty-eight healthy subjects participated in this study. In experiment 1, the effects of task movement speed on the spinal neural circuits were examined. Eighteen subjects performed a visuomotor task involving ankle muscle slow (nine subjects) or fast (nine subjects) movement speed. Another nine subjects performed a non-visuomotor task (controls) in fast movement speed. The motor task training lasted for 20 min. The amounts of D1 inhibition and reciprocal Ia inhibition were measured using H-relfex condition-test paradigm and recorded before, and at 5, 15, and 30 min after the training session. In experiment 2, using transcranial magnetic stimulation (TMS), the effects of corticospinal descending inputs on the presynaptic inhibitory pathway were examined before and after performing either a visuomotor (eight subjects) or a control task (eight subjects). All measurements were taken under resting conditions. The amount of D1 inhibition increased after the visuomotor task irrespective of movement speed (P < 0.01). The amount of reciprocal Ia inhibition increased with fast movement speed conditioning (P < 0.01), but was unchanged by slow movement speed conditioning. These changes lasted up to 15 min in D1 inhibition and 5 min in reciprocal Ia inhibition after the training session. The control task did not induce changes in D1 inhibition and reciprocal Ia inhibition. The TMS conditioned inhibitory effects of presynaptic inhibitory pathways decreased following visuomotor tasks (P < 0.01). The size of test H-reflex was almost the same size throughout experiments. The results suggest that supraspinal descending inputs for controlling joint movement are responsible for changes in the spinal neural circuits, and that task movement speed is one of the critical factors for inducing plastic changes in reciprocal Ia inhibition.
Keywords: movement speed; presynaptic inhibition; reciprocal Ia inhibition; spinal plasticity; visuomotor task.
Figures
Similar articles
-
Inter-individual variation in reciprocal Ia inhibition is dependent on the descending volleys delivered from corticospinal neurons to Ia interneurons.J Electromyogr Kinesiol. 2014 Feb;24(1):46-51. doi: 10.1016/j.jelekin.2013.11.004. Epub 2013 Nov 20. J Electromyogr Kinesiol. 2014. PMID: 24321700 Clinical Trial.
-
Presynaptic control of group Ia afferents in relation to acquisition of a visuo-motor skill in healthy humans.J Physiol. 2005 Oct 1;568(Pt 1):343-54. doi: 10.1113/jphysiol.2005.089904. Epub 2005 Jul 28. J Physiol. 2005. PMID: 16051628 Free PMC article.
-
Modulation of presynaptic inhibition and disynaptic reciprocal Ia inhibition during voluntary movement in spasticity.Brain. 2001 Apr;124(Pt 4):826-37. doi: 10.1093/brain/124.4.826. Brain. 2001. PMID: 11287381 Clinical Trial.
-
Contributions to the understanding of gait control.Dan Med J. 2014 Apr;61(4):B4823. Dan Med J. 2014. PMID: 24814597 Review.
-
Reciprocal inhibition in man.Dan Med Bull. 1993 Nov;40(5):571-81. Dan Med Bull. 1993. PMID: 8299401 Review.
Cited by
-
Effects of repetitive passive movement on ankle joint on spinal reciprocal inhibition.Exp Brain Res. 2019 Dec;237(12):3409-3417. doi: 10.1007/s00221-019-05689-7. Epub 2019 Nov 14. Exp Brain Res. 2019. PMID: 31728595
-
Corticospinal and spinal adaptations following lower limb motor skill training: a meta-analysis with best evidence synthesis.Exp Brain Res. 2023 Mar;241(3):807-824. doi: 10.1007/s00221-023-06563-3. Epub 2023 Feb 5. Exp Brain Res. 2023. PMID: 36740653 Review.
-
Spinal plasticity with motor imagery practice.J Physiol. 2019 Feb;597(3):921-934. doi: 10.1113/JP276694. Epub 2018 Dec 5. J Physiol. 2019. PMID: 30417924 Free PMC article.
References
-
- Cheney P. D., Fetz E. E. (1980). Functional classes of primate corticomotoneuronal cells and their relation to active force. J. Neurophysiol. 44, 773–791. - PubMed
-
- Cowley K. C., Schmidt B. J. (1995). Effects of inhibitory amino acid antagonists on reciprocal inhibitory interactions during rhythmic motor activity in the in vitro neonatal rat spinal cord. J. Neurophysiol. 74, 1109–1117. - PubMed
LinkOut - more resources
Full Text Sources
Other Literature Sources