. 2015 Dec 15:6:1408.
doi: 10.3389/fmicb.2015.01408. eCollection 2015.

Intestinal Microbiota Signatures Associated with Inflammation History in Mice Experiencing Recurring Colitis

Affiliations

Intestinal Microbiota Signatures Associated with Inflammation History in Mice Experiencing Recurring Colitis

David Berry et al. Front Microbiol. .

Abstract

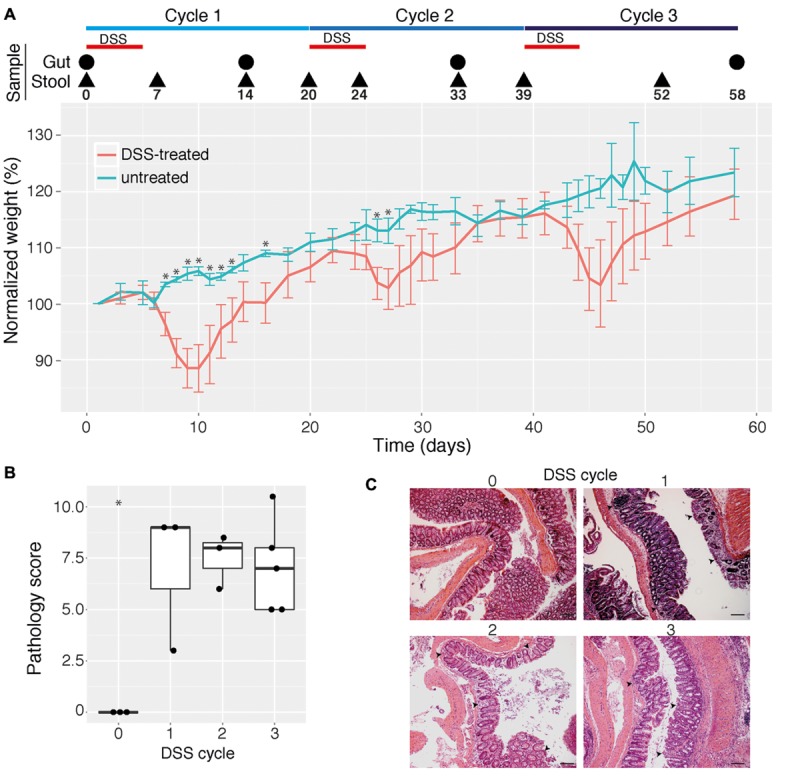
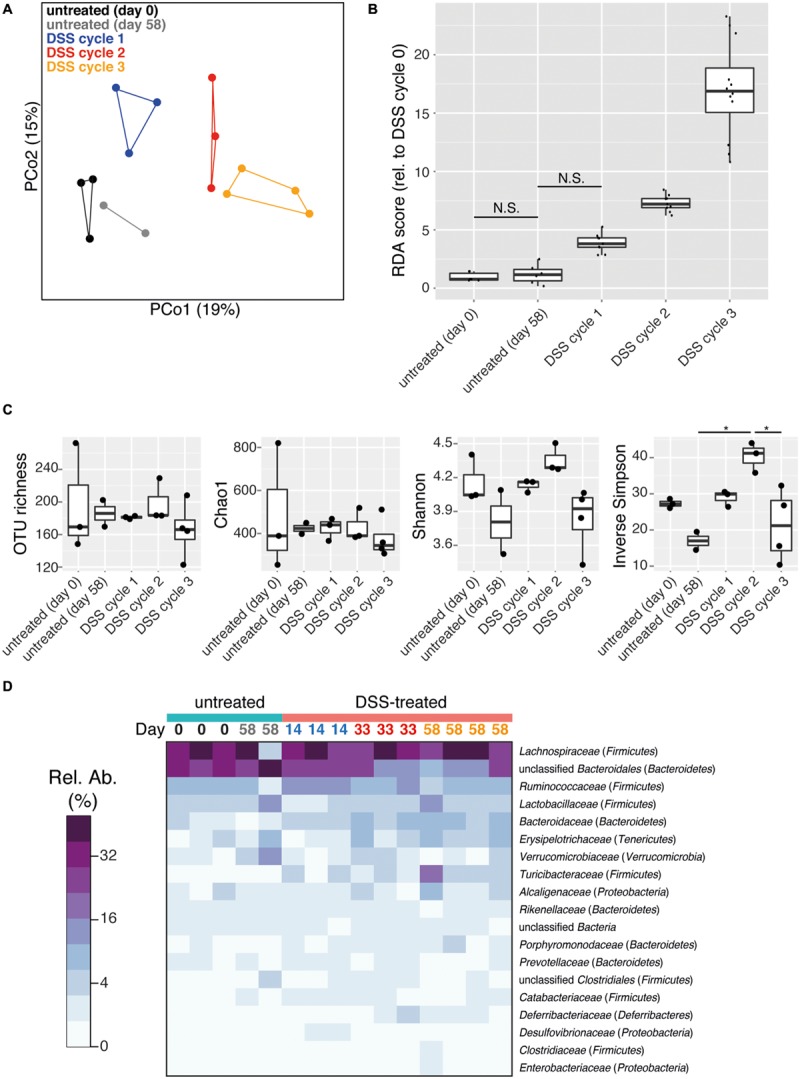
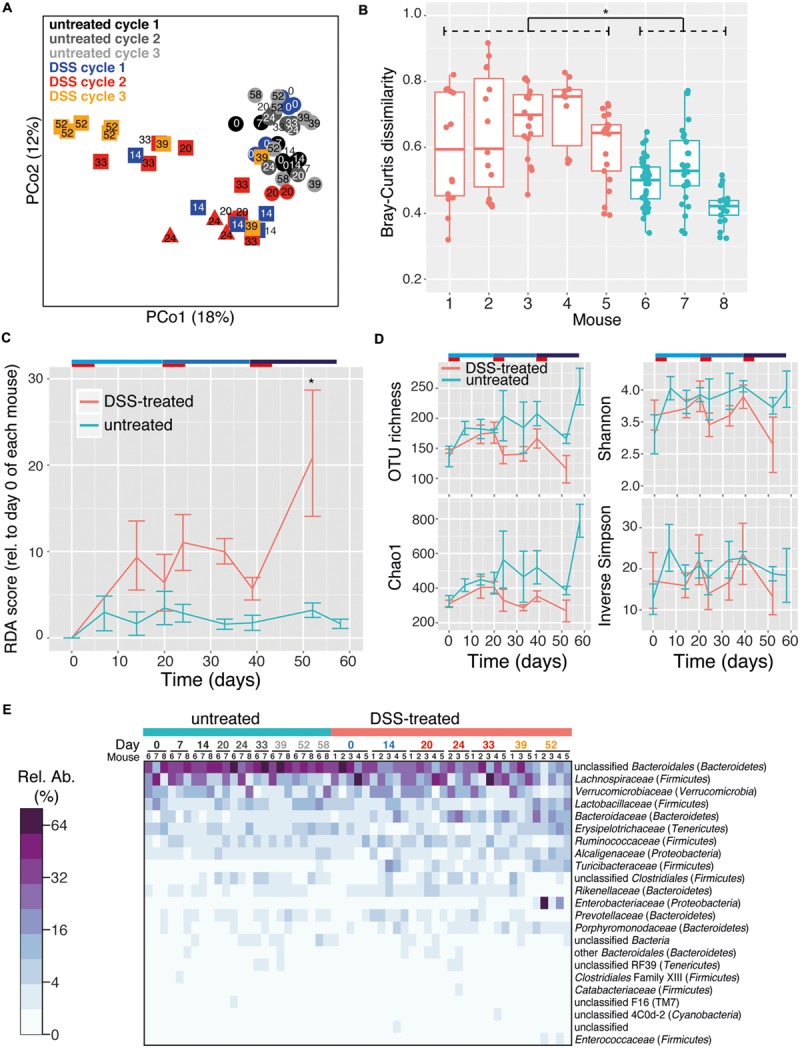
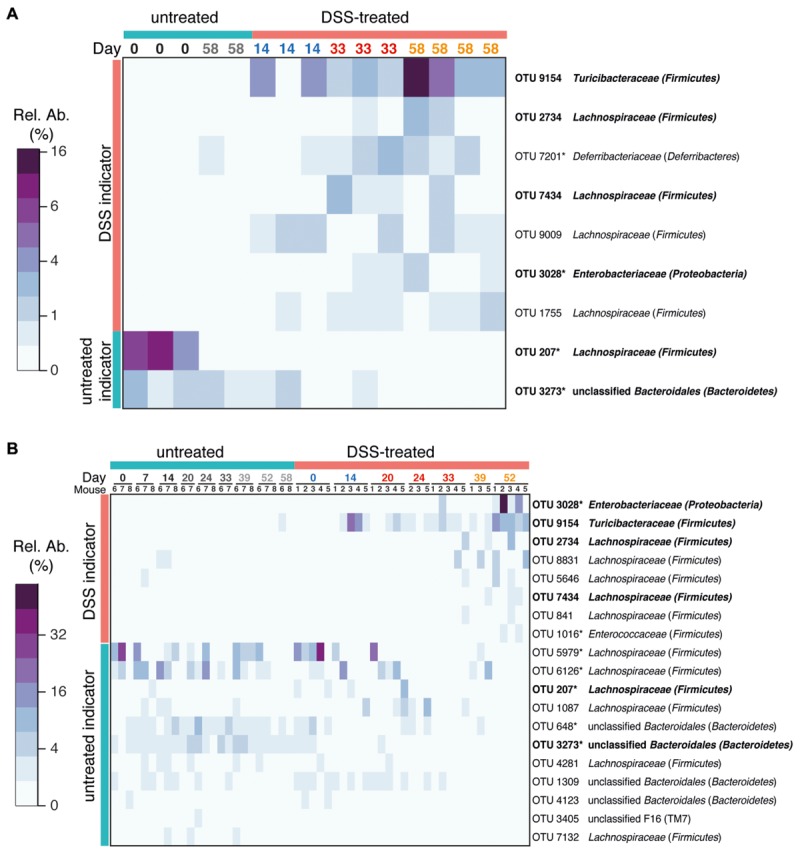
Acute colitis causes alterations in the intestinal microbiota, but the microbiota is thought to recover after such events. Extreme microbiota alterations are characteristic of human chronic inflammatory bowel diseases, although alterations reported in different studies are divergent and sometimes even contradictory. To better understand the impact of periodic disturbances on the intestinal microbiota and its compositional difference between acute and relapsing colitis, we investigated the beginnings of recurrent inflammation using the dextran sodium sulfate (DSS) mouse model of chemically induced colitis. Using bacterial 16S rRNA gene-targeted pyrosequencing as well as quantitative fluorescence in situ hybridization, we profiled the intestinal and stool microbiota of mice over the course of three rounds of DSS-induced colitis and recovery. We found that characteristic inflammation-associated microbiota could be detected in recovery-phase mice. Successive inflammation episodes further drove the microbiota into an increasingly altered composition post-inflammation, and signatures of colitis history were detectable in the microbiota more sensitively than by pathology analysis. Bacterial indicators of murine colitis history were identified in intestinal and stool samples, with a high degree of consistency between both sample types. Stool may therefore be a promising non-invasive source of bacterial biomarkers that are highly sensitive to inflammation state and history.

Keywords: Akkermansia; Bacteroides; DSS; FISH; IBD; Mucispirillum; colitis.


Figures

FIGURE 1
FIGURE 1
Effect of multiple cycles of dextran sodium sulfate (DSS) treatment in mice. (A) Mean change in weight (in percent) for mice given three cycles of 2% DSS in drinking water (indicated by red horizontal bars) as well as untreated control mice (n = 3–11 for each data point). Mice were sampled for intestinal (cecum and colon) contents and pathology analysis as well as for stool analysis at selected time points (indicated by a circle or triangle, respectively, and the day number). Error bars indicate 95% confidence interval and asterisks indicate days where for which there is a statistically significant difference in weights between control and treatment groups (p < 0.05, corrected for multiple comparisons). Weight dynamics for individual mice are shown in Supplementary Figure S1. (B) Pathology scores of colon mucosal tissue from mice give 0, 1, 2, or 3 cycles of DSS. Pathology scores were calculated as the sum of inflammation severity and extent, crypt depth, and area of inflammation, as determined by an experienced pathologist. Asterisk indicates statistically significant difference compared with all other groups (p < 0.05). (C) Representative photomicrographs (10× magnification) of hematoxylin and eosin-stained colon tissues obtained from untreated and DSS-treated mice. Black scale bars are 200 μm. Arrows indicate infiltrates of immune cells.
FIGURE 2
FIGURE 2
DSS treatment shapes recovery-phase intestinal microbiota composition and diversity. All data is from intestinal (cecum and colon) flush samples. (A) Principal coordinates analysis (PCoA) using the Bray–Curtis dissimilarity metric reveals clustering of samples based on number of DSS treatment cycles (points are connected by lines to illustrate clustering). This clustering is statistically supported by the ANOSIM test (R = 0.3379, p = 0.003). (B) Differences in microbiota composition relative to day 0 untreated samples based on redundancy analysis are shown. All pairwise comparisons between groups are significant (p < 0.05) except for those joined by a horizontal bar labeled N.S. (C) Estimation of microbial community richness (observed OTU richness and Chao1 estimated richness) and diversity (Shannon and inverse Simpson indices) for each sample. For all analyses sequence libraries were sub-sampled to 1000 reads. An asterisk indicates a significant difference between groups (ANOVA and Tukey’s HSD post hoc test, p < 0.05). (D) Heatmap of the relative abundance of family-level taxa (rows) for each sample (columns). The abundance is shown in relative percent and the scale is square root transformed to allow visualization of less abundant groups. Families with at least 1% relative abundance in at least one sample are shown. Columns are labeled with sample day and color-coded by DSS cycle (1 = blue, 2 = red, 3 = orange).
FIGURE 3
FIGURE 3
DSS treatment shapes fecal pellet intestinal microbiota composition and diversity. Fecal pellets were collected immediately upon defecation from untreated as well as DSS treated (in both acute and recovery phases) mice. (A) PCoA using the Bray–Curtis dissimilarity metric displays a trend toward clustering of samples based on number of DSS treatment cycles. This is statistically supported by the ANOSIM test (R = 0.3254, p = 0.001). Circles indicate untreated mice, triangles and squares indicate the acute and recovery phases of inflammation, respectively. (B) Microbiota stability per mouse, as determined by pairwise Bray–Curtis dissimilarity values calculated from multiple samples from each mouse. DSS-treated mice (red, #1–5) had significantly higher dissimilarity values as untreated mice (blue, #6–8), indicating a less stable microbiota composition throughout the duration of the entire experiment (Asterisk indicates p < 0.05). (C) The mean and standard deviation of the microbial community at successive time points relative to day 0 for each mouse based on redundancy analysis. Higher values indicate increasing divergence from the starting community. An asterisk signifies a difference between treated and untreated mice at that time point (p < 0.05). (D) Estimation of microbial community richness (observed OTU richness and Chao1 estimated richness) and diversity (Shannon and inverse Simpson indices) for each sample (mean and standard deviation shown). Observed OTU richness and Chao1 estimated richness were significantly reduced in the DSS treated group (ANOVA, p < 0.001). For all analyses sequence libraries were sub-sampled to 1000 reads. (E) Heatmap of the relative abundance of family-level taxa (rows) for each sample (columns). The abundance is shown in relative percent and the scale is square root transformed to allow visualization of less abundant groups. Families with at least 1% relative abundance in at least one sample are shown.
FIGURE 4
FIGURE 4
Bacterial indicators of colitis history. OTUs characteristic for prior DSS treatment were determined using indicator species analysis. Heatmaps of the relative abundance of each OTU is shown. Only abundant OTUs (>1% relative abundance in at least one sample) were evaluated. (A) Indicator OTUs from gut flush samples. (B) Indicator OTUs from stool samples. Indicators from stool were identified by comparing samples from untreated mice with samples from mice treated with three cycles of DSS (day 52) using indicator species analysis. Only OTUs that were significantly associated with prior treatment or controls are shown (p < 0.05). OTUs identified in both intestinal flush and stool samples are shown in bold. Asterisks after the OTU ID indicates that this OTU was also identified in intestinal flush (cecum and colon) samples as an indicator of acute DSS-induced colitis or of untreated mice in a previous study (all OTUs share 100% sequence similarity over at least 400 nt with previously identified OTUs; Berry et al., 2012). See Supplementary Figure S5 for a phylogenetic tree of indicator OTUs.

References

    1. Allison S. D., Martiny J. B. H. (2008). Resistance, resilience, and redundancy in microbial communities. Proc. Natl. Acad. Sci. U.S.A. 105(Suppl. 1) 11512–11519. 10.1073/pnas.0801925105 - DOI - PMC - PubMed
    1. Angelberger S., Reinisch W., Makristathis A., Lichtenberger C., Dejaco C., Papay P., et al. (2013). Temporal bacterial community dynamics vary among ulcerative colitis patients after fecal microbiota transplantation. Am. J. Gastroenterol. 108 1620–1630. 10.1038/ajg.2013.257 - DOI - PubMed
    1. Berry D., Ben Mahfoudh K., Wagner M., Loy A. (2011). Barcoded primers used in multiplex amplicon pyrosequencing bias amplification. Appl. Environ. Microbiol. 77 7846–7849. 10.1128/AEM.05220-11 - DOI - PMC - PubMed
    1. Berry D., Reinisch W. (2013). Intestinal microbiota: a source of novel biomarkers in inflammatory bowel diseases? Best Pract. Res. Clin. Gastroenterol. 27 47–58. 10.1016/j.bpg.2013.03.005 - DOI - PubMed
    1. Berry D., Schwab C., Milinovich G., Reichert J., Ben Mahfoudh K., Decker T., et al. (2012). Phylotype-level 16S rRNA analysis reveals new bacterial indicators of health state in acute murine colitis. ISME J. 6 2091–2106. 10.1038/ismej.2012.39 - DOI - PMC - PubMed

LinkOut - more resources