. 2015 Dec 2:6:1063.
doi: 10.3389/fpls.2015.01063. eCollection 2015.

Polyamine and Its Metabolite H2O2 Play a Key Role in the Conversion of Embryogenic Callus into Somatic Embryos in Upland Cotton (Gossypium hirsutum L.)

Affiliations

Polyamine and Its Metabolite H2O2 Play a Key Role in the Conversion of Embryogenic Callus into Somatic Embryos in Upland Cotton (Gossypium hirsutum L.)

Wen-Han Cheng et al. Front Plant Sci. .

Abstract

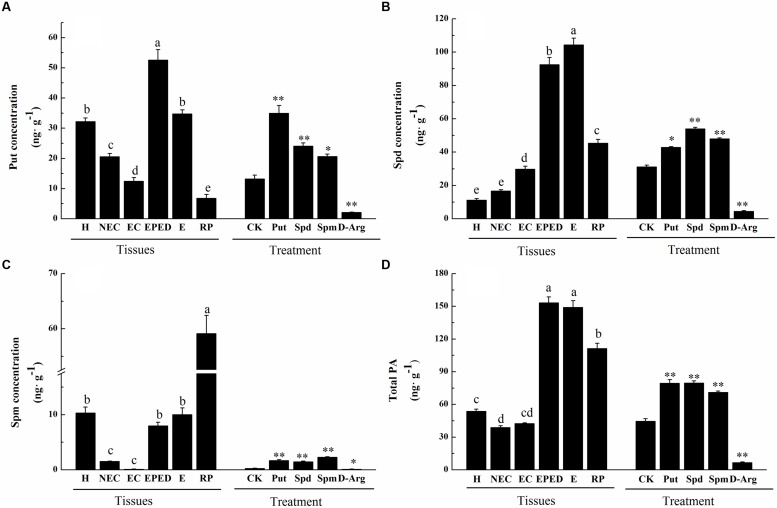
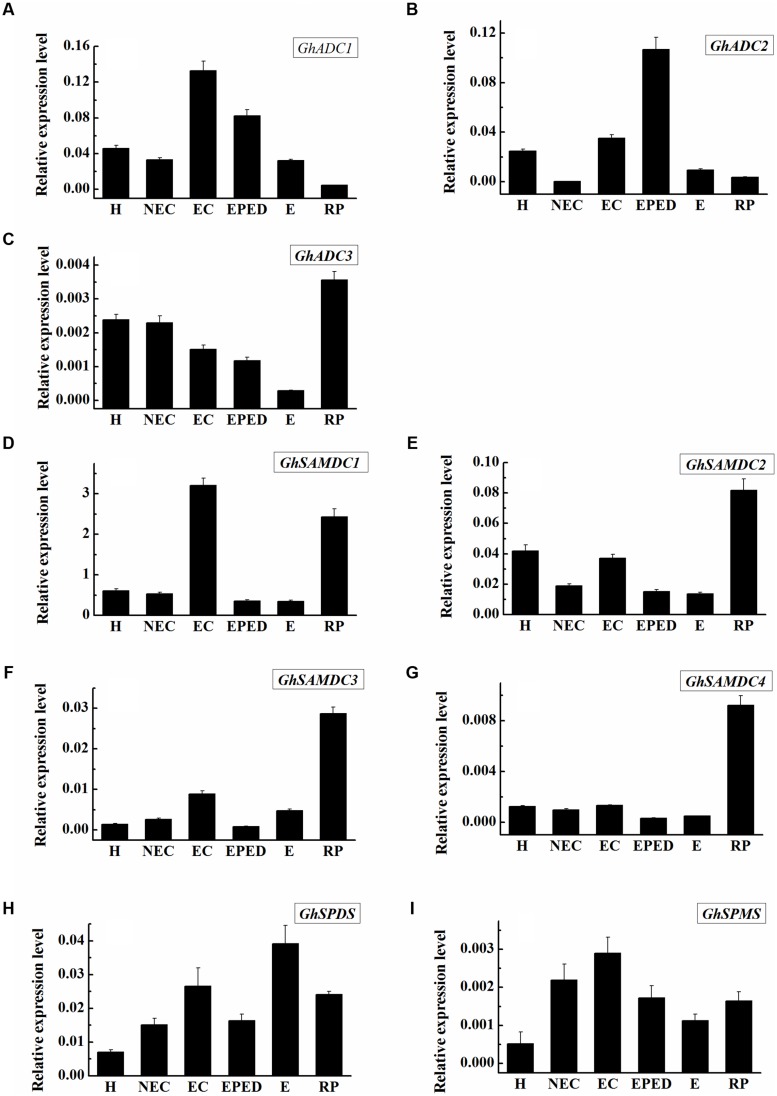
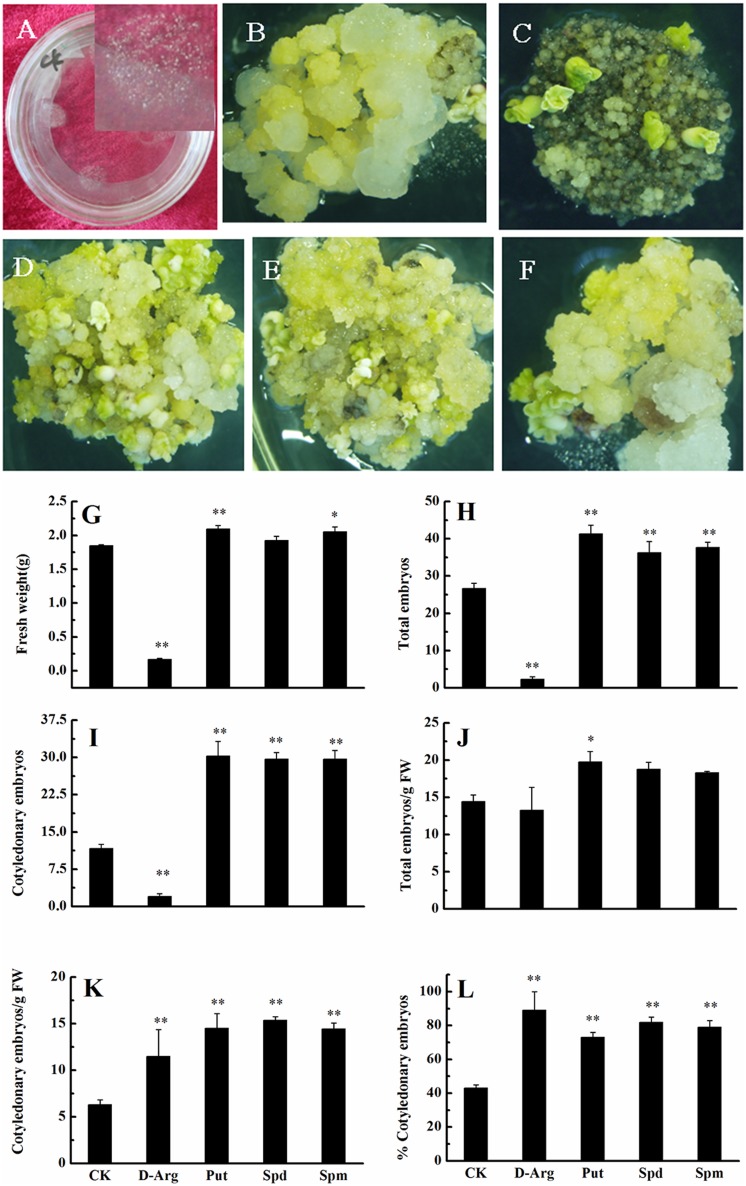
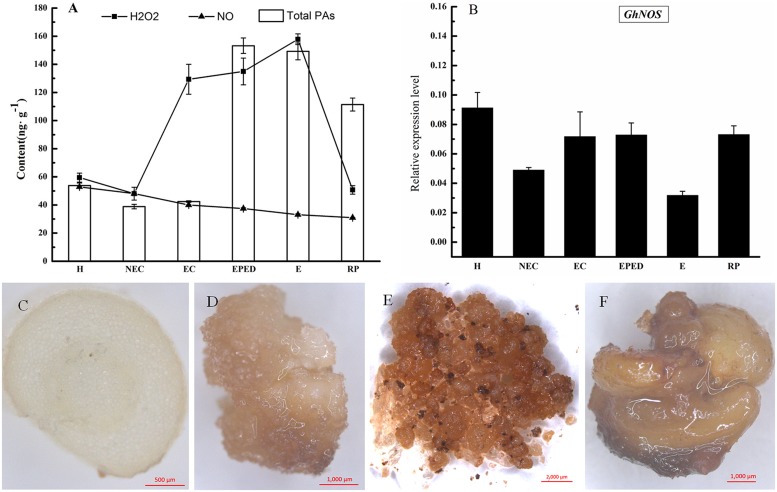
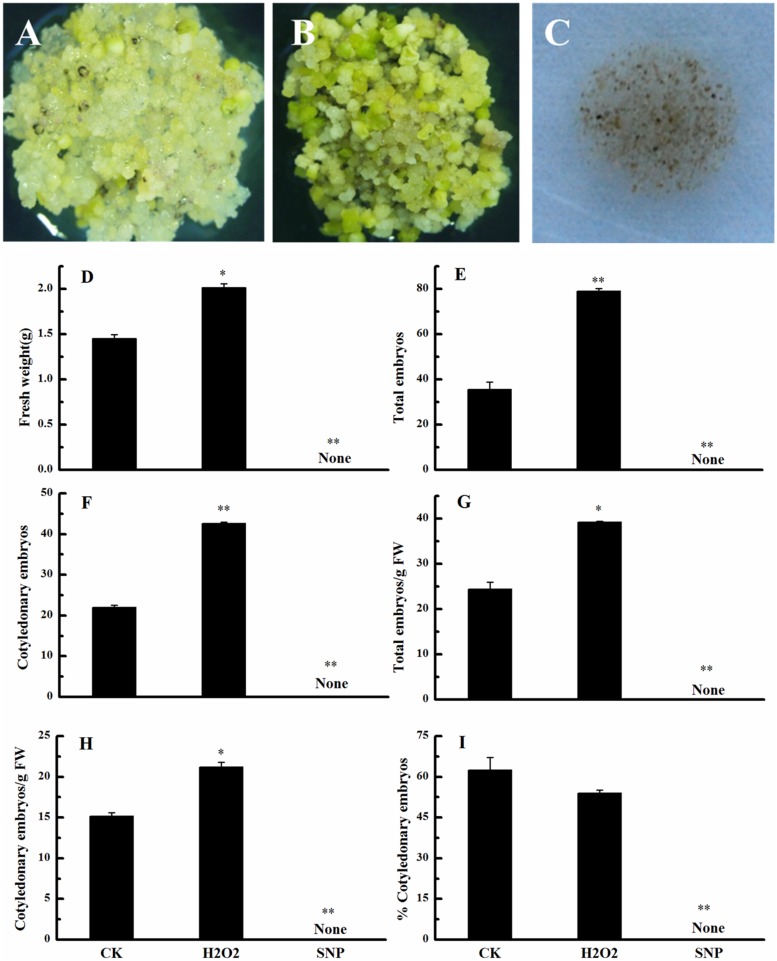
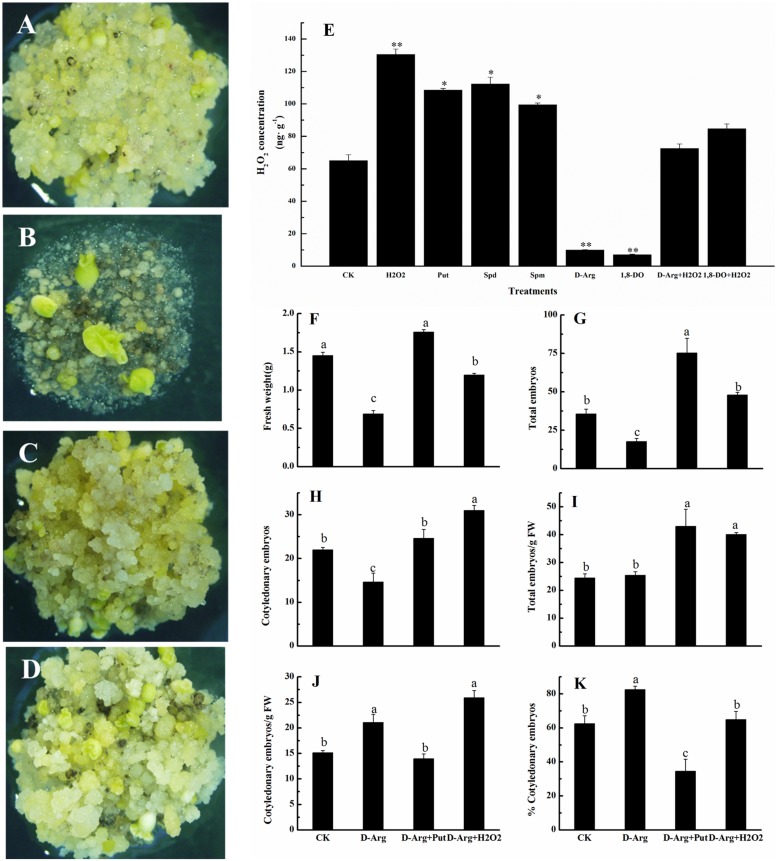
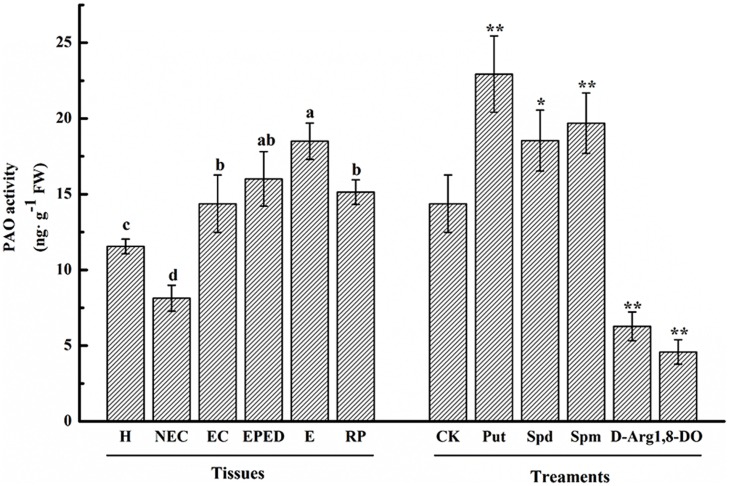
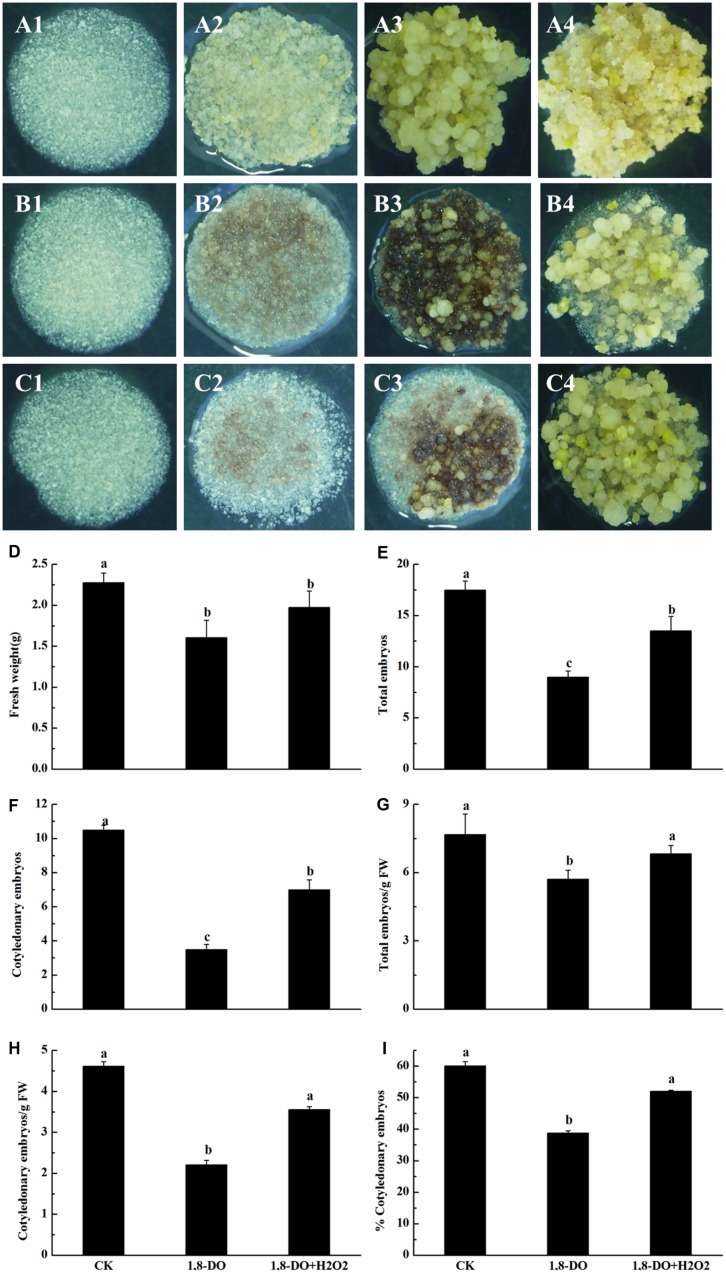
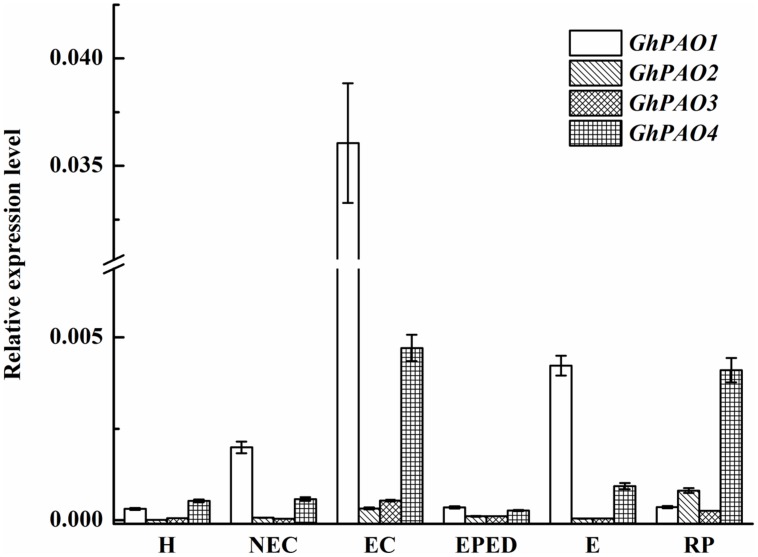
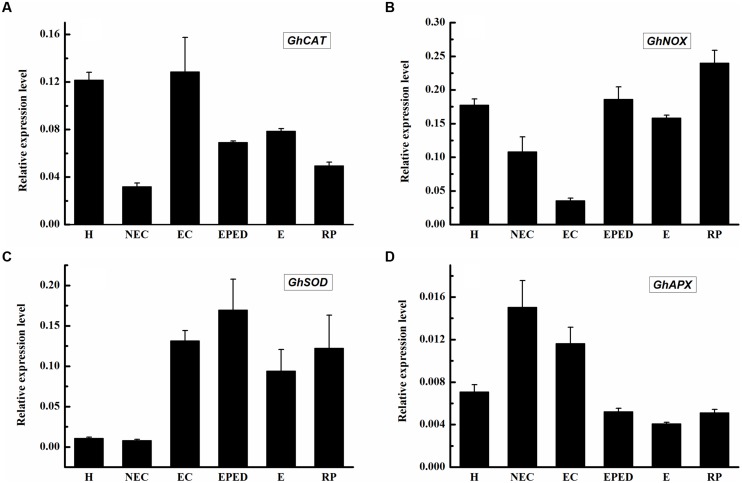
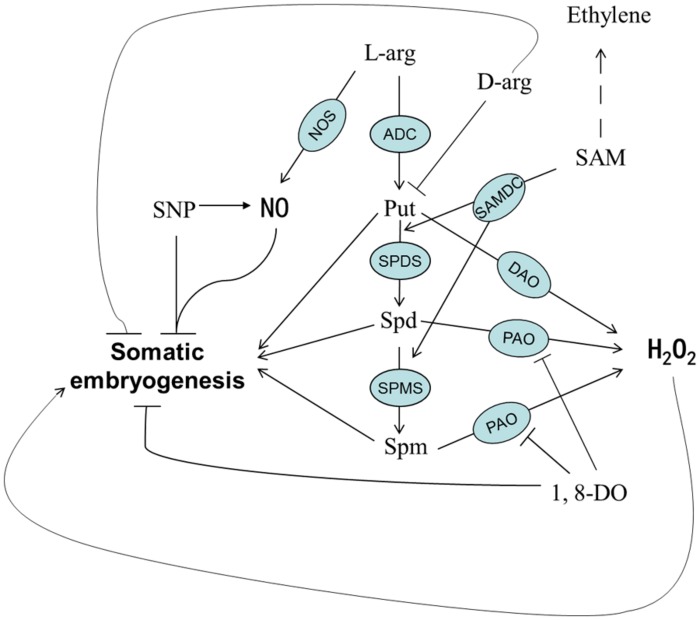
The objective of this study was to increase understanding about the mechanism by which polyamines (PAs) promote the conversion of embryogenic calli (EC) into somatic embryos in cotton (Gossypium hirsutum L.). We measured the levels of endogenous PAs and H2O2, quantified the expression levels of genes involved in the PAs pathway at various stages of cotton somatic embryogenesis (SE), and investigated the effects of exogenous PAs and H2O2 on differentiation and development of EC. Putrescine (Put), spermidine (Spd), and spermine (Spm) significantly increased from the EC stage to the early phase of embryo differentiation. The levels of Put then decreased until the somatic embryo stage whereas Spd and Spm remained nearly the same. The expression profiles of GhADC genes were consistent with changes in Put during cotton SE. The H2O2 concentrations began to increase significantly at the EC stage, during which time both GhPAO1 and GhPAO4 expressions were highest and PAO activity was significantly increased. Exogenous Put, Spd, Spm, and H2O2 not only enhanced embryogenic callus growth and embryo formation, but also alleviated the effects of D-arginine and 1, 8-diamino-octane, which are inhibitors of PA synthesis and PAO activity. Overall, the results suggest that both PAs and their metabolic product H2O2 are essential for the conversion of EC into somatic embryos in cotton.

Keywords: hydrogen peroxide (H2O2); nitric oxide (NO); polyamine oxidase (PAO); polyamines (PAs); somatic embryogenesis (SE); upland cotton.


Figures

FIGURE 1
FIGURE 1
Polyamine concentrations at different stages of somatic embryogenesis (SE) in ‘Xinluzao 33’ and the effects of different chemical treatments on polyamine concentrations. (A) Putrescine concentration. (B) Spermidine concentration. (C) Spermine concentration. (D) Total PA. Abbreviations on the x-axis: H, hypocotyl; NEC, non-embryogenic callus; EC, embryogenic callus; EPED, early phase of embryo differentiation; E, embryo; RP, regenerated plantlets. Treatment on the x-axis, CK, control; D-Arg, D-arginine treatment; Put, putrescine treatment; Spd, spermidine treatment; Spm, spermine treatment. Values are the mean + standard error (n = 3). Different lowercase letters above the bars indicate significant differences at P < 0.05 according to LSD multiple range test. and ∗∗ indicate significant differences compared with the control at P < 0.05 and P < 0.01, respectively, according to LSD multiple range test.
FIGURE 2
FIGURE 2
Expression level of genes encoding SAMDC, ADC, SPDS and SPMS during SE in ‘Xinluzao 33’. The equation 2-ΔCt was applied to calculate the relative expression level using GhUBI as the reference gene. (A–I) Relative expression level of GhSAMDC1/2/3/4, GhADC1/2/3, GhSPDS and GhSPMS. (A) Relative expression level of GhADC1. (B) Relative expression level of GhADC2. (C) Relative expression level of GhADC3. (D) Relative expression level of GhSAMDC1. (E) Relative expression level of GhSAMDC2. (F) Relative expression level of GhSAMDC3. (G) Relative expression level of GhSAMDC4. (H) Relative expression level of GhSPDS. (I) Relative expression level of GhSPMS. Abbreviations on the x-axis: H, Hypocotyl; NEC, Non-embryogenic callus; EC, Embryogenic callus; EPED, Early phase of embryo differentiation; E, Embryo; RP, Regenerated plantlets. Values are the mean + standard error (n = 3).
FIGURE 3
FIGURE 3
Effects of exogenous PA and D-arg on the conversion of embryogenic callus into somatic embryos in ‘Xinluzao 33.’ (A) Initial status of embryogenic callus after passing through a 50 mesh sieve. (B–F) Status of embryogenic callus after 30 days on the somatic embryo induction medium. (B) Untreated medium (control). (C) D-arginine treatment. (D) Put treatment. (E) Spd treatment. (F) Spm treatment. (G–L) Statistic analysis of different treatments. (G) Fresh weight (g). (H) Total embryo number. (I) Cotyledonary embryo number. (J) Total embryo embryo number/g FW. (K) Cotyledonary embryo number/g FW. (L) % Cotyledonary embryos. Abbreviations on the x-axes: CK, control; D-Arg, D-arginine treatment; Put, putrescine treatment; Spd, spermidine treatment; Spm, spermine treatment. Data are mean + standard error (n = 3). and ∗∗ indicate significant differences compared with the control at P < 0.05 and P < 0.01, respectively, according to LSD multiple range test.
FIGURE 4
FIGURE 4
Determination of H2O2 and NO levels during SE in ‘Xinluzao 33.’ (A) The concentration of H2O2, NO, and total PA at different stages of SE. Abbreviations on the x-axis: H, hypocotyl; NEC, non-embryogenic callus; EC, embryogenic callus; EPED, early phase of embryo differentiation; E, embryo; RP, regenerated plantlets. (B) Expression level of GhNOS during SE. (C–F) Detection of hydrogen peroxide by DAB. (C) Transverse sliced hypocotyl. (D) Non-embryogenic callus; (E) Embryogenic callus; (F) Somatic embryos.
FIGURE 5
FIGURE 5
Effects of exogenous H2O2 and NO on the conversion of embryogenic callus into somatic embryos in ‘Xinluzao 33.’ (A–C) Status of embryogenic callus after 30 days on somatic embryo induction medium. (A) Untreated medium (CK). (B) H2O2 treatment. (C) Sodium nitroprussiate (SNP, a NO donor) treatment. (D–I) Statistical analysis of the treatments. (D) Fresh weight (g). (E) Total embryo number. (F) Cotyledonary embryo number. (G) Total embryo number/g FW. (H) Cotyledonary embryo number/g FW. (I) % Cotyledonary embryos. Abbreviations on the x-axes: CK, control; H2O2, H2O2 treatment; SNP, sodium nitroprussiate treatment. Data are mean + standard error (n = 3). and ∗∗ indicate significant differences at P < 0.05 and P < 0.01, respectively, according to LSD multiple range test.
FIGURE 6
FIGURE 6
H2O2 alleviated the inhibitory effect of D-Arg and promoted the conversion of embryogenic callus into somatic embryos in ‘Xinluzao 33.’ (A–D) Status of embryogenic callus after 30 days on the media. (A) Status of embryogenic callus after 30 days on the untreated media as control. (B) D-arginine treatment. (C) D-arginine + Put treatment. (D) D-arginine + H2O2 treatment. (E) H2O2 concentration in the H2O2, Put, Spd, Spm, D-Arg, 1, 8-DO, D-Arg + H2O2 and 1, 8-DO + H2O2 treatments. and ∗∗ indicate significant differences at P < 0.05 and P < 0.01, respectively, according to LSD multiple range test. (F–K) Statistical analysis of the treatments. (F) Fresh weight (g). (G) Total embryos. (H) Cotyledonary embryos. (I) Total embryos/g FW. (J) Cotyledonary embryos/g FW. (K) % Cotyledonary embryos. The horizontal axis of (F–K) were same, CK: control, D-Arg: D-arginine treatment, D-Arg + Put: media supplement with D-arginine and putrescine, D-Arg + H2O2: media supplemented with D-arginine and H2O2. Values are the mean + standard error (n = 3). Different lowercase letters above the bars indicate significant differences at P < 0.05 according to LSD multiple range tests.
FIGURE 7
FIGURE 7
Polyamine oxidase activity during SE of ‘Xinluzao 33.’ The horizontal axis tissues H, hypocotyl; NEC, non-embryogenic callus; EC, embryogenic callus; EPED, early phase of embryo differentiation; E, embryo; RP, regenerated plantlets. The treatments are liquid embryo induction media supplemented with Put, Spd, Spm, D-arg and 1, 8-DO 3 days after inoculation of embryogenic callus. CK is unamended induction medium. Values are the mean + standard error (n = 3). Different lowercase letters above the bars indicated significant differences in PAO activity among the stages at P < 0.05. and ∗∗ indicate significant differences at P < 0.05 and P < 0.01, respectively, according to LSD multiple range test.
FIGURE 8
FIGURE 8
Polyamine oxidase influenced the conversion of embryogenic callus into somatic embryos of ‘Xinluzao 33.’ (A1–4 to C1–4) Represent the status of embryogenic callus on the media at different times during the culture (1: 0 days; 2: 3 days; 3: 10 days; 4: 30 days). (A) Status of embryogenic callus on the untreated media (control). (B) 1, 8-DO treatment. (C) 1, 8-DO + H2O2 treatment. The cultures in 1, 8-DO exhibited browning and underwent necrosis early in the incubation, probably due to loss of efficiency of 1, 8-DO. The cultures recovered after about 10 days and then grew better. (D–I) Statistical analysis of different treatments. (D) Fresh weight (g). (E) Total embryos. (F) Cotyledonary embryos. (G) Total embryos/g FW. (H) Cotyledonary embryos/g FW. (I) % Cotyledonary embryos. The horizontal axis of D-I were same, CK: control, 1, 8-DO: 1, 8-diamino-octane treatment, 1, 8-DO + H2O2: media supplement with 1, 8-diamino-octane and H2O2. Values are the mean + standard error (n = 3). Different lowercase letters above the bars indicate significant differences at P < 0.05 according to LSD multiple range test.
FIGURE 9
FIGURE 9
Relative expression of GhPAO1-4 during SE in ‘Xinluzao 33.’ The equation 2-ΔCt was applied to calculate the relative expression level using GhUBI as the reference gene. The horizontal axis: H, hypocotyl; NEC, non-embryogenic callus; EC, embryogenic callus; EPED, early phase of embryo differentiation; E, embryo; RP, regenerated plantlets. Values are the mean + standard error (n = 3).
FIGURE 10
FIGURE 10
Expression level of genes encoding CAT, SOD, APX and NOX during SE in ‘Xinluzao 33’. The equation 2-ΔCt was applied to calculate the relative expression level using GhUBI as the reference gene. (A–D) Relative expression level of GhCAT, GhNOX, GhSOD and GhAPX. (A) Relative expression level of GhCAT. (B) Relative expression level of GhNOX. (C) Relative expression level of GhSOD. (D) Relative expression level of GhAPX. The horizontal axis: H, Hypocotyl; NEC, Non-embryogenic callus; EC, Embryogenic callus; EPED, Early phase of embryo differentiation; E, Embryo; RP, Regenerated plantlets. Values are the mean + standard error (n = 3).
FIGURE 11
FIGURE 11
A proposed model of PA metabolism and possible involvement of PA-related chemicals during SE in cotton.

References

    1. Alcázar R., Tiburcio A. F. (2014). Plant polyamines in stress and development: an emerging area of research in plant sciences. Front. Plant Sci. 5:319 10.3389/fpls.2014.00319 - DOI - PMC - PubMed
    1. Alscher R. G., Donahue J. L., Cramer C. L. (1997). Reactive oxygen species and antioxidants: relationships in green cells. Physiol. Plant. 100 224–233. 10.1111/j.1399-3054.1997.tb04778.x - DOI
    1. Altman A., Friedman R. A., Levin N. (1982). Arginine and ornithine decarboxylases, the polyamine biosynthetic enzymes of mung bean seedlings. Plant physiol. 69 876–879. 10.1104/pp.69.4.876 - DOI - PMC - PubMed
    1. Berna A., Bernier F. (1999). Regulation by biotic and abiotic stress of a wheat germin gene encoding oxalate oxidase, a H2O2-producing enzyme. Plant Mol. Biol. 39 539–549. 10.1023/A:1006123432157 - DOI - PubMed
    1. Boerjan W., Ralph J., Baucher M. (2003). Lignin biosynthesis. Annu. Rev. Plant Biol. 54 519–546. 10.1146/annurev.arplant.54.031902.134938 - DOI - PubMed

LinkOut - more resources