. 2015 Dec 15:6:1096.
doi: 10.3389/fpls.2015.01096. eCollection 2015.

Mendelizing all Components of a Pyramid of Three Yield QTL in Tomato

Affiliations

Mendelizing all Components of a Pyramid of Three Yield QTL in Tomato

Amit Gur et al. Front Plant Sci. .

Abstract

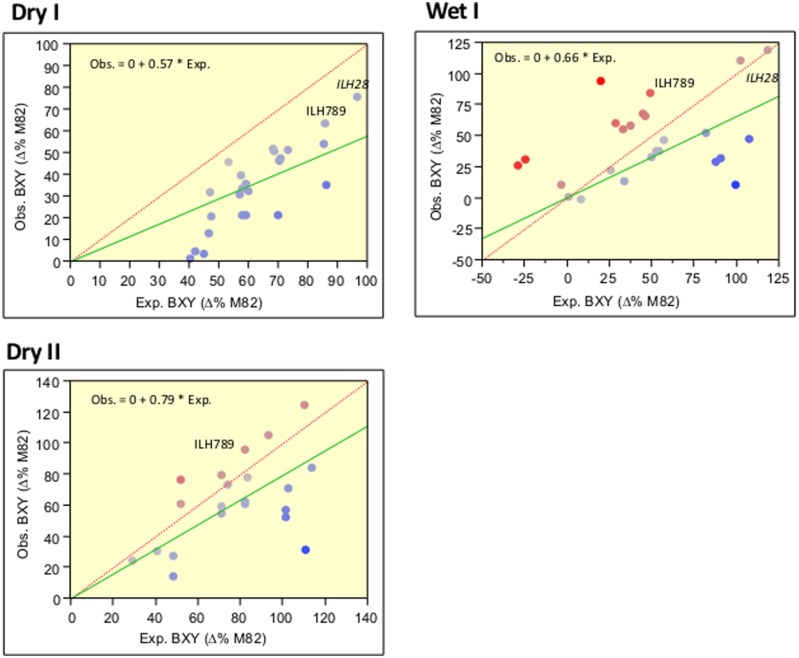
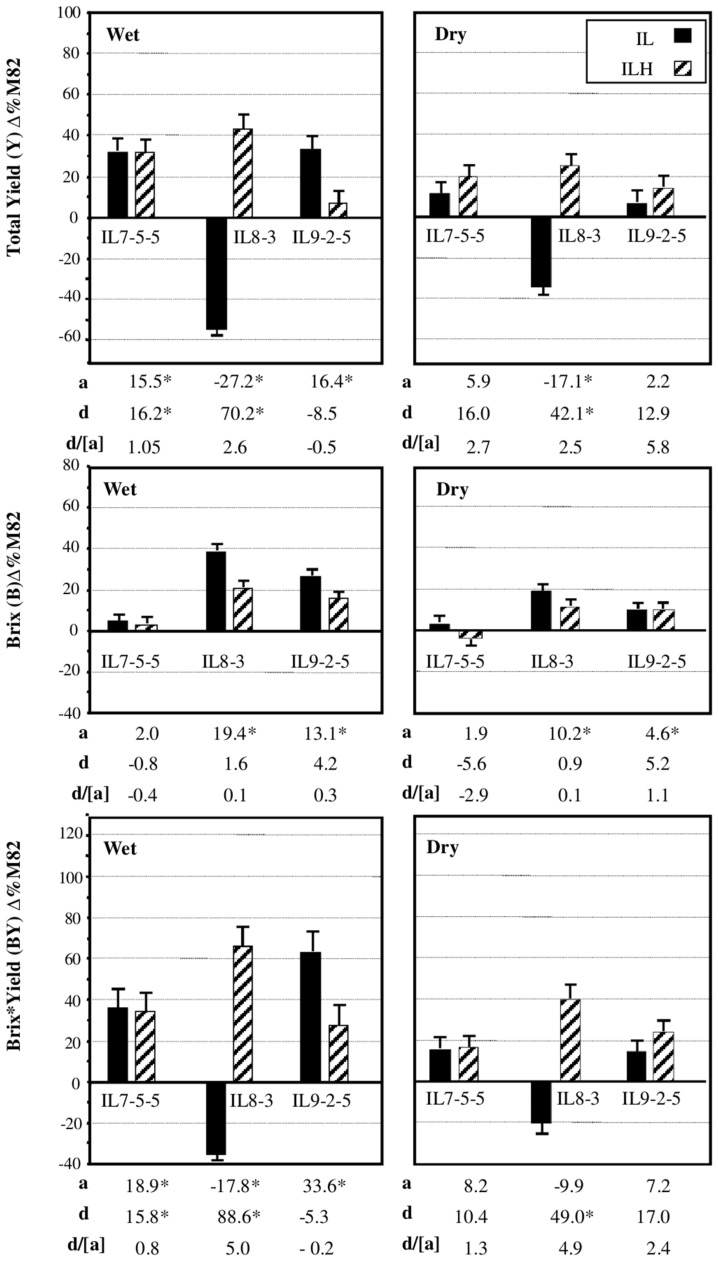
Molecular markers allowed breeders to mendelize quantitative trait loci (QTL) providing another demonstration that quantitative traits are governed by the same principles as single qualitative genes. This research extends the QTL analysis to two and three QTL and tests our ability to mendelize an oligogenic trait. In tomato, agricultural yield is determined by the weight of the fruits harvested per unit area and the total soluble solids (% Brix)-sugars and acids. The current study explores the segregation of multiple independent yield-related QTL that were identified and mapped using introgression lines (IL) of Solanum pennellii in cultivated processing tomato (S. lycopersicum). We screened 45 different double and triple IL-QTL combinations for agricultural yield, to identify QTL pyramids that behaved in an additive manner and were suitable substrate for mendelizing an oligogenic trait. A pyramid of three independent QTL that significantly improved Brix(∗)Yield (BXY - the soluble solids output per unit area) compared to M82 was selected. In the progenies of the tri-hybrid we bred using markers a nearly isogenic 'immortalized F2.' While the common mode of QTL-QTL interactions across the 45 IL-QTLs combinations was less than additive, the three QTLs in the selected triple-stack performed in an additive manner which made it an exceptional material for breeding. This study demonstrates that using the phenotypic effect of all 27 possible QTL-alleles combinations it is possible to make reliable predictions about the genotypes that will maximize the yield.

Keywords: QTL; epistasis; mendelizing; tomato; wild species; yield.


Figures

FIGURE 1
FIGURE 1
Workflow for creation of IL789 pyramids and the ‘3-way Immortalized F2.’ (A) BXY quantitative trait loci (QTL) map (Gur et al., 2011) used as the basis for selection of target IL-QTLs for pyramiding. The 12 tomato chromosomes are shown. Gray bars on the left of each chromosome are positions of introgressions at each of the Solanum pennellii ILs (Eshed and Zamir, 1995, http://solgenomics.net/). Red bars are introgression lines that showed significant increase in BXY compared to M82. (B) Description of the workflow for creation of the different QTL stacks. (C) The ‘All-Heterozygote’ pyramid, composed of single, double and triple introgression lines that were backcrossed to M82; all introgressions are present at the heterozygote state (ILH; IL-Hybrid). (D) Crossing scheme for producing 27 immortalized F2 segregants for the three QTL pyramid. Single, double and triple homozygote ILs were intermated to create the ‘3-way immortalized F2’. The numbers (7, 8, or 9) indicate the chromosome number and refer to the presence in homozygote state of S. pennellii introgressions IL7-5-5, IL8-3, and IL9-2-5, respectively. For the 27 genotypes at the ‘immortalized F2’ table; L = homozygote lycopersicum, H = Heterozygote, P = homozygote pennellii. Genotypes are expressed in the following order: IL7-5-5/IL8-3/IL9-2-5.
FIGURE 2
FIGURE 2
Correlations between expected and observed BXY across 45 double and triple hybrids in the wet and dry fields over 2 years. Expected (X axis) and observed (Y axis) BXY values are presented for double and triple ILHs that resulted from crosses between single or double ILs. BXY values are presented as percent difference from M82. Expected values were calculated as the sum of the single ILH effects, assuming complete additivity. The dashed red line represents the expected regression line where X = Y and intercept is 0,0. The green line represents the observed regression line, with the intercept constrained to 0,0, which is the value of M82. Equations for the observed by expected regression lines are presented at the left upper corner of each box. Slopes of all regression lines are significantly lower than 1. The Red-to-Blue scale reflects the deviation from the X = Y line.
FIGURE 3
FIGURE 3
Interaction plots for yield components between the underlying QTLs at the ILH28 double-stack. Two-locus genotypic effects for ILH2-5, ILH8-3, and the double introgression hybrid ILH28. Presented are plots for BrixYield (BXY; g sugar/m2), Total Yield (TY; Kg/m2), Fruit Weight (FW; g), Brix (BX; %). X axis (Chr8) are genotypes at IL8-3. The red lines represent genotypes homozygous for the S. lycopersicum allele at IL2-5, the green lines represent genotypes heterozygous at IL2-5. L = homozygote S. lycopersicum allele. H = Heterozygote. Chr2 reffer to IL2-5, Chr8 refer to IL8-3. Chr2xChr8 reflects the interaction as calculated from a two-way ANOVA.
FIGURE 4
FIGURE 4
Phenotypic effects of IL 7-5-5, IL8-3 and IL9-2-5 under Dry and Wet field conditions. Introgression lines IL7-5-5, IL8-3, and IL9-2-5 were compared to M82 (data are presented as percent difference from M82) in homozygous (IL) and heterozygous (ILH) states, under Wet and Dry field condition. The bars represent total yield (TY), Brix (BX), and BrixYield (BXY) least-square means (± standard error) from three growing seasons; these data were pooled, since no season × genotype interactions were found. The baseline represents M82, where the mean BXY values of M82 from the three seasons was 353 g/m2 in the irrigated treatment and 184 g/m2 in the dry treatment. The additive effect (a) is half of the difference between each IL and M82. The dominance deviation (d) is the difference between ILH and the mid-value of its parents. Values marked by an asterisk are significant changes from baseline (p < 0.05). All experiments were transplanted in a randomized block design with 10–15 replications per entry.
FIGURE 5
FIGURE 5
3D genotype and BXY of the IL789 pyramid. Each node represents a genotype from the 27 (3∧3) combinations. The different axes represent the different introgressions on chromosome 7, 8, and 9. L = homozygote lycopersicum, H = Heterozygote, P = homozygote pennellii. Colors reflect the mean BXY values for each genotype as calculated from 20 replicates of single plants. The green dashed line highlights single QTL effects.
FIGURE 6
FIGURE 6
Predicted vs. observed BXY for partial and complete models. Regressions of predicted vs. observed BXY values for the 27 ‘immortalized F2’ genotypes. (A) Partial model: predicted values were calculated based on model with main effects alone. (B) Full model: predicted values were calculated based on model with main effects + QTL by QTL interactions. The Red-to-Blue scale reflects the deviation from the predicted regression line.
FIGURE 7
FIGURE 7
Linear pyramiding effect: regression of favorable allele count against BXY, across 27 segregants from the IL789 pyramid. The X axis is the favorable (S. pennellii) allele count. All wild alleles were counted in the same manner as +1, except for the pennellii allele at IL8-3 when present as a homozygote (P); this genotype was counted as -1 due to the negative impact of a recessive gene within this introgression causing partial sterility.

Similar articles

Cited by

References

    1. Ashikari M., Matsuoka M. (2006). Identification, isolation and pyramiding of quantitative trait loci for rice breeding. Trends Plant Sci. 11 344–350. 10.1016/j.tplants.2006.05.008 - DOI - PubMed
    1. Bateson W. (1909). Mendel’s Principles of Heredity. Cambridge: Cambridge University Press.
    1. Bernatzky R., Tanksley S. D. (1986). Methods for detection of single or low copy sequences in tomato on southern blots. Plant Mol. Biol. Rep. 4 37–41. 10.1007/BF02672487 - DOI
    1. Buckler E. S., Holland J. B., Bradbury P. J., Acharya C. B., Brown P. J., Browne C., et al. (2009). The genetic architecture of maize flowering time. Science 325 714–718. 10.1126/science.1174276 - DOI - PubMed
    1. Carlborg O., Haley C. S. (2004). Epistasis: too often neglected in complex trait studies. Nat. Rev. Genet. 5 618–625. 10.1038/nrg1407 - DOI - PubMed

LinkOut - more resources