. 2015 Dec 21:8:217.
doi: 10.1186/s13068-015-0379-8. eCollection 2015.

Mechanism of lignin inhibition of enzymatic biomass deconstruction

Affiliations

Mechanism of lignin inhibition of enzymatic biomass deconstruction

Josh V Vermaas et al. Biotechnol Biofuels. .

Abstract

Background: The conversion of plant biomass to ethanol via enzymatic cellulose hydrolysis offers a potentially sustainable route to biofuel production. However, the inhibition of enzymatic activity in pretreated biomass by lignin severely limits the efficiency of this process.

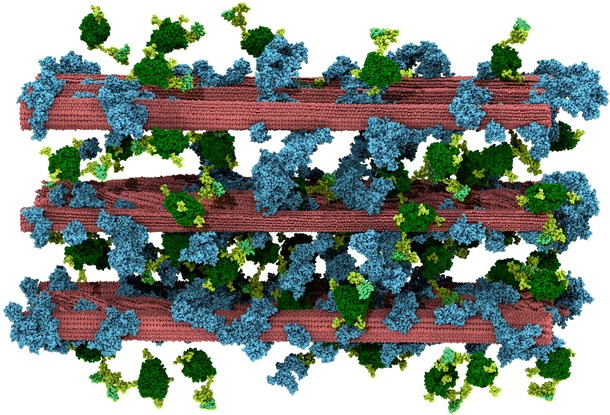
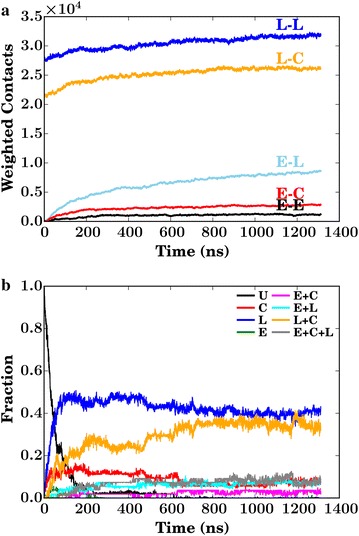
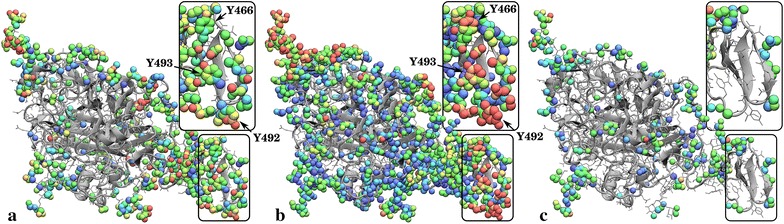
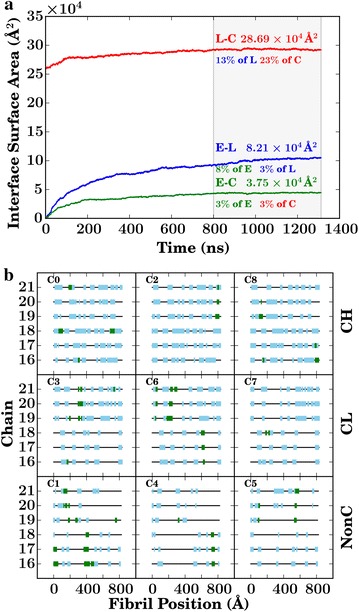
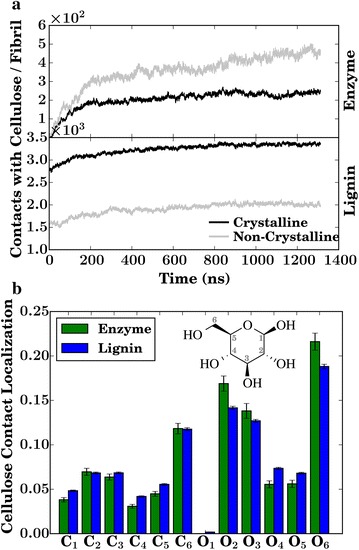
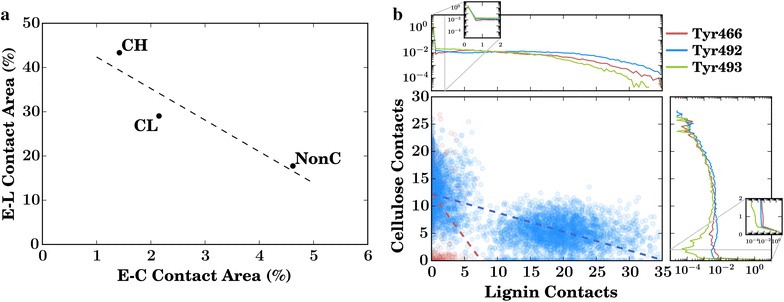
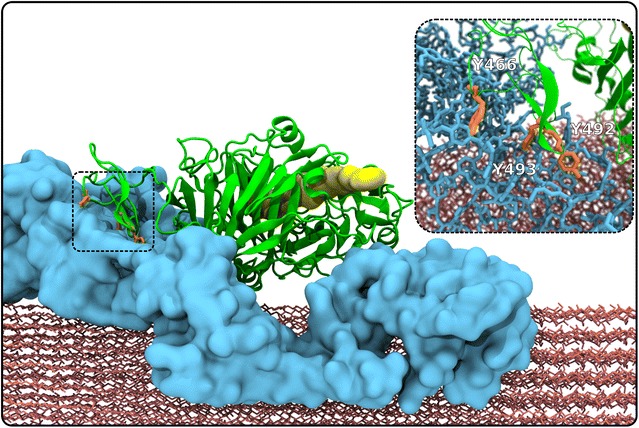
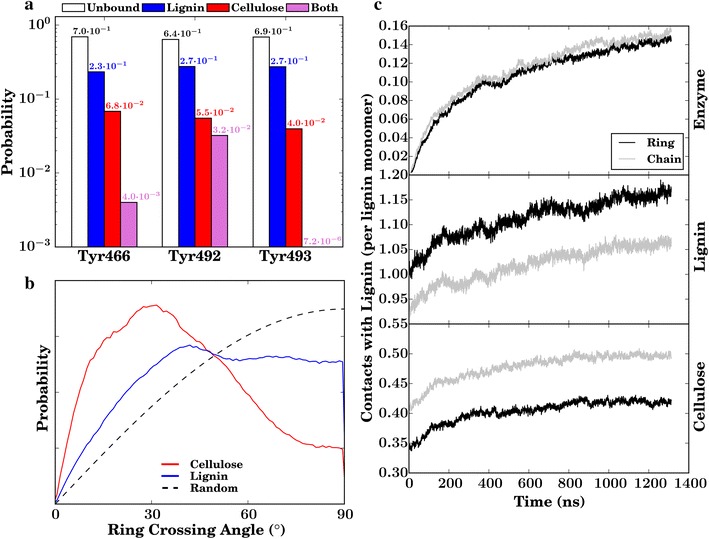
Results: By performing atomic-detail molecular dynamics simulation of a biomass model containing cellulose, lignin, and cellulases (TrCel7A), we elucidate detailed lignin inhibition mechanisms. We find that lignin binds preferentially both to the elements of cellulose to which the cellulases also preferentially bind (the hydrophobic faces) and also to the specific residues on the cellulose-binding module of the cellulase that are critical for cellulose binding of TrCel7A (Y466, Y492, and Y493).

Conclusions: Lignin thus binds exactly where for industrial purposes it is least desired, providing a simple explanation of why hydrolysis yields increase with lignin removal.

Keywords: Biofuel; Cel7A; Cellulose crystallinity; Lignin.


Figures

Fig. 1
Fig. 1
Side view of the initial state of the lignocellulosic biomass system. Cellulose fibrils are red, lignin molecules blue, and TrCel7A enzymes green; the CBMs have a lighter color than the CDs, while glycosylations and linker regions are in pastel green. An animation from this starting structure is given as an Additional file 1
Fig. 2
Fig. 2
a Contact counts as a function of time between enzyme E, lignin L, and cellulose C molecules. b Time traces of the fraction of the 54 enzymes that are unbound, U; bound only to cellulose, C; bound only to lignin, L; bound only to other enzymes, E; bound to enzymes and cellulose, E+C; bound to enzymes and lignin, E+L; bound to lignin and cellulose, L+C; bound to other enzymes, lignin and cellulose, E+C+L. In this analysis, an enzyme is said to be bound if any of its heavy atoms are within 3.2 Å of a heavy atom in another molecule
Fig. 3
Fig. 3
Schematic representation of the network formed by the individual biomass components at the end of the simulation. Each circle represents one element of the system: the large red circles are for cellulose fibrils, the small blue circles are for lignin molecules, and the intermediate green circles are for TrCel7A enzymes. The black lines connecting the components indicate a contact between two components, and the thickness represents the degree of contact (the contact number). The position of the individual particles is arbitrary, with the position determined using the ForceAtlas algorithm of Gephi [45], which treats the connection as springs connecting the elements. An animation of the time-evolution of this representation is given as an Additional file 3
Fig. 4
Fig. 4
Number of contacts, averaged over all enzymes and over the last 300 ns of simulation, at the end of the simulation of TrCel7A with cellulose (a), lignin (b), and other enzymes (c) mapped onto a model of TrCel7A. Cooler (blue) colors indicate fewer contacts, while warmer (red) indicate more. These figures are also available as Additional file 4: Video S1; Additional file 5: Video S2; Additional file 6: Video S3 as well as downloadable pdb files where the contact number is in the beta column (Additional files 7, 8 and 9)
Fig. 5
Fig. 5
a Interface surface area for cellulose (C), lignin (L), and enzymes (E), their means values (for t>800 ns) labeled above the curves. The % fraction of interface area over the total surface area of a species is also labeled below the curves. b Pictorial representation of the final configuration of the simulation, showing the positions of lignins (blue) and enzymes (green) on the hydrophobic surface of the nine cellulose fibrils (black line). The average “procession length” (distance along the fibril between two lignin clusters) depends on the type of fibril. CH fibrils have the shortest procession lengths (3.5 nm), CL fibrils intermediate (5.5 nm), and NonC the longest (9.2 nm)
Fig. 6
Fig. 6
a Contacts per fibril of crystalline and non-crystalline cellulose with the enzyme and with lignin. b Normalized number of contacts between any specific cellulose heavy atom and lignin and enzymes
Fig. 7
Fig. 7
a Fraction of hydrophobic cellulose covered by lignin and enzymes per cellulose fibril type. Individual fibril types are labeled. The dotted line is a linear regression to the data. This contains the same information as Table 2. b Comparison of the number of simultaneous contacts between the specific CBM tyrosine residues, with a scatterplot in the main panel, and log-probability distributions for direct comparisons along each axis
Fig. 8
Fig. 8
Snapshot of the simulation in which TrCel7A (green cartoon) is bound unproductively to a lignin cluster (blue surface) on a cellulose fiber (red). The CBM residues Y466, Y492, and Y493 are orange. The location CD catalytic tunnel is shown by a yellow spacefilling representation, and is provided for reference. No cellulose was within the tunnel at any point during the simulation, as the complete fibrils did not decrystallize. The inset is an enlarged image delineated by the dotted rectangle, which highlights the Tyr (orange)–lignin (blue) interactions. A gallery of images showing the cases where TrCel7A enzymes interact with cellulose are provided in the supplementary information†
Fig. 9
Fig. 9
a Probabilities of the three CBM Tyr residues (466, 492, and 493) being contact in contact to only lignin, only cellulose, both lignin and not bound to either (unbound). b The crossing angle between the ring normals of the three CBM Tyr residues (466, 492, and 493) and the closest (within 5 Å) biomass ring (the glucose ring of cellulose or the phenolic ring of lignin). The dotted lines are distributions that would be obtained without an angular energetic preference from a random distribution. c Number of contacts per lignin residue with the enzyme (top), other lignins (middle), or cellulose (bottom). Contacts are labeled as “ring” when involving the lignin atoms C1–C6, O3, O4, and C10, while “chain” involves atoms C7–C9, O7–O9
Fig. 10
Fig. 10
Accuracy (top) and runtime (bottom) of a conventional approach vs. our GPU-accelerated surface area calculation for test atom selections of a given size. The r-value for the linear fit between the conventional surface area and the GPU-calculated surface area is 0.99997 with a slope of 0.9997; however the intercept in the plot is not zero, indicating a consistent percentage offset of ~20 %. The runtimes represent the time required to calculate the surface area of a single atom selection once

Similar articles

Cited by

References

    1. Chu S, Majumdar A. Opportunities and challenges for a sustainable energy future. Nature. 2012;488(7411):294–303. doi: 10.1038/nature11475. - DOI - PubMed
    1. Himmel ME, Ding SY, Johnson DK, Adney WS, Nimlos MR, Brady JW, Foust TD. Biomass recalcitrance: engineering plants and enzymes for biofuels production. Science. 2007;315(5813):804–807. doi: 10.1126/science.1137016. - DOI - PubMed
    1. Jorgensen H, Kristensen JB, Felby C. Enzymatic conversion of lignocellulose into fermentable sugars: challenges and opportunities. Biofuels Bioprod Biorefin. 2007;1(2):119–134. doi: 10.1002/bbb.4. - DOI
    1. Chen F, Dixon RA. Lignin modification improves fermentable sugar yields for biofuel production. Nat Biotechnol. 2007;25(7):759–761. doi: 10.1038/nbt1316. - DOI - PubMed
    1. Yang B, Wyman CE. Pretreatment: the key to unlocking low-cost cellulosic ethanol. Biofuel Bioprod Biorefining. 2008;2(1):26–40. doi: 10.1002/bbb.49. - DOI