

Radiomic Machine-Learning Classifiers for Prognostic Biomarkers of Head and Neck Cancer
- PMID: 26697407
- PMCID: PMC4668290
- DOI: 10.3389/fonc.2015.00272
Radiomic Machine-Learning Classifiers for Prognostic Biomarkers of Head and Neck Cancer
Abstract
Introduction: "Radiomics" extracts and mines a large number of medical imaging features in a non-invasive and cost-effective way. The underlying assumption of radiomics is that these imaging features quantify phenotypic characteristics of an entire tumor. In order to enhance applicability of radiomics in clinical oncology, highly accurate and reliable machine-learning approaches are required. In this radiomic study, 13 feature selection methods and 11 machine-learning classification methods were evaluated in terms of their performance and stability for predicting overall survival in head and neck cancer patients.
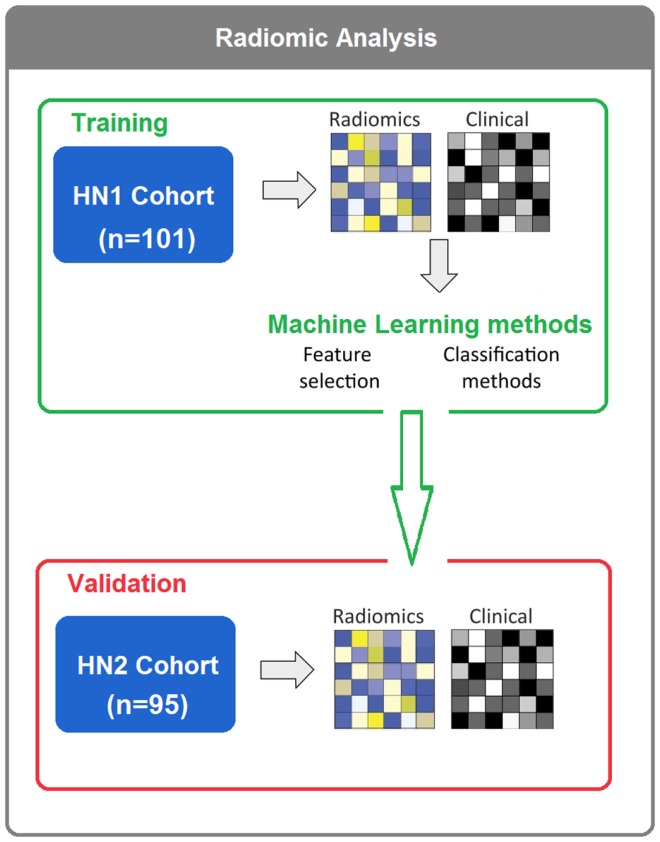
Methods: Two independent head and neck cancer cohorts were investigated. Training cohort HN1 consisted of 101 head and neck cancer patients. Cohort HN2 (n = 95) was used for validation. A total of 440 radiomic features were extracted from the segmented tumor regions in CT images. Feature selection and classification methods were compared using an unbiased evaluation framework.
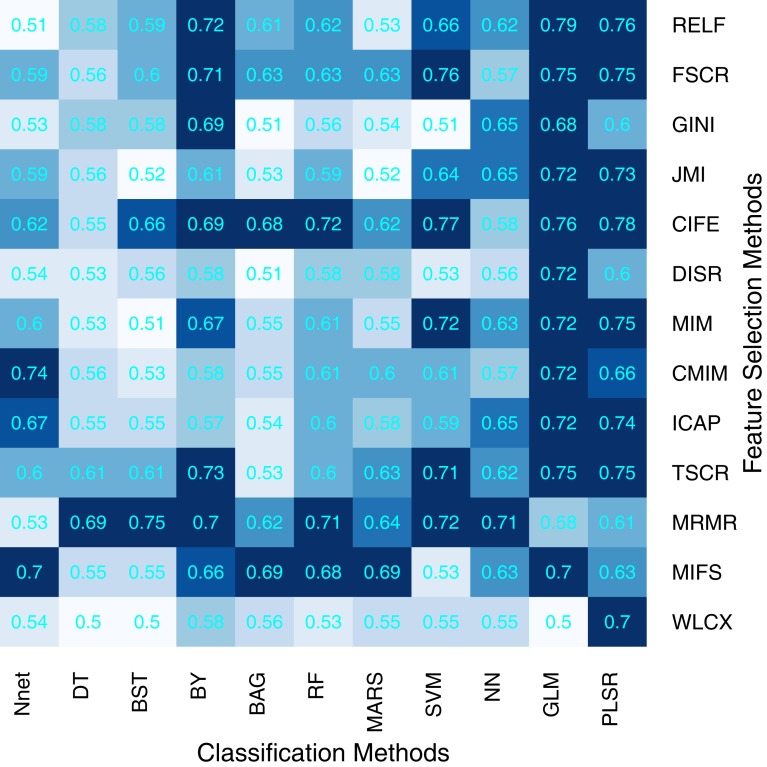
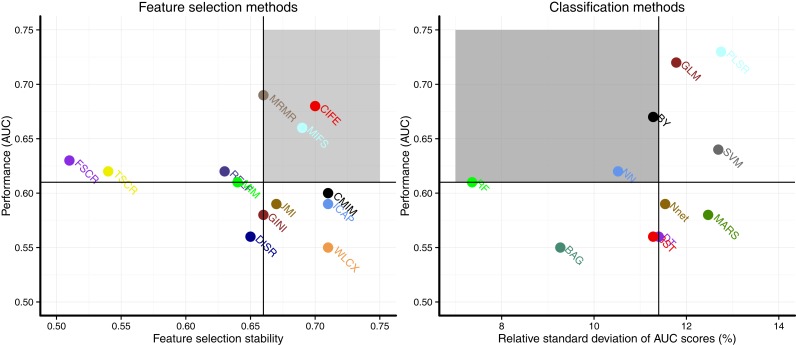
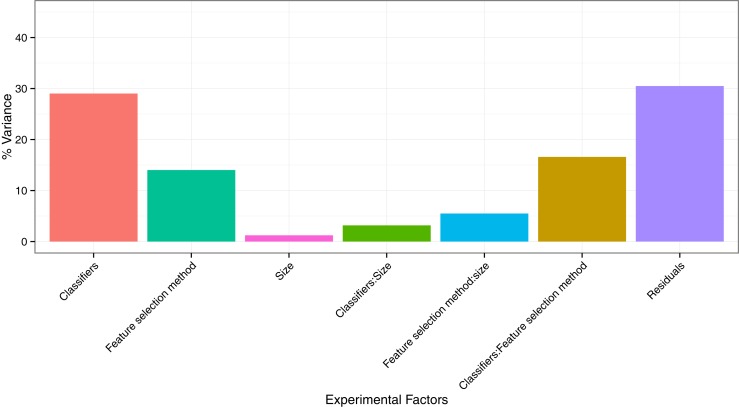
Results: We observed that the three feature selection methods minimum redundancy maximum relevance (AUC = 0.69, Stability = 0.66), mutual information feature selection (AUC = 0.66, Stability = 0.69), and conditional infomax feature extraction (AUC = 0.68, Stability = 0.7) had high prognostic performance and stability. The three classifiers BY (AUC = 0.67, RSD = 11.28), RF (AUC = 0.61, RSD = 7.36), and NN (AUC = 0.62, RSD = 10.52) also showed high prognostic performance and stability. Analysis investigating performance variability indicated that the choice of classification method is the major factor driving the performance variation (29.02% of total variance).
Conclusion: Our study identified prognostic and reliable machine-learning methods for the prediction of overall survival of head and neck cancer patients. Identification of optimal machine-learning methods for radiomics-based prognostic analyses could broaden the scope of radiomics in precision oncology and cancer care.
Keywords: cancer; computational science; machine learning; quantitative imaging; radiology; radiomics.
Figures
References
-
- Szerlip NJ, Pedraza A, Chakravarty D, Azim M, McGuire J, Fang Y, et al. Intratumoral heterogeneity of receptor tyrosine kinases EGFR and PDGFRA amplification in glioblastoma defines subpopulations with distinct growth factor response. Proc Natl Acad Sci U S A (2012) 109(8):3041–6. 10.1073/pnas.1114033109 - DOI - PMC - PubMed
Grants and funding
LinkOut - more resources
Full Text Sources
Other Literature Sources