

Using 4D Cardiovascular Magnetic Resonance Imaging to Validate Computational Fluid Dynamics: A Case Study
- PMID: 26697416
- PMCID: PMC4677094
- DOI: 10.3389/fped.2015.00107
Using 4D Cardiovascular Magnetic Resonance Imaging to Validate Computational Fluid Dynamics: A Case Study
Abstract
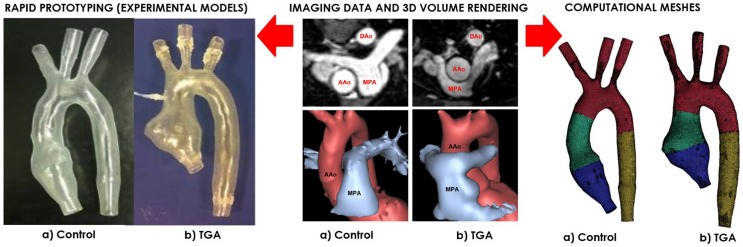
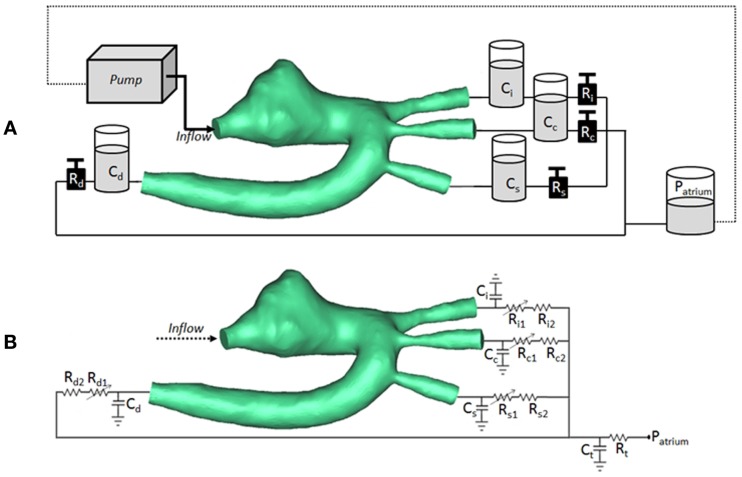
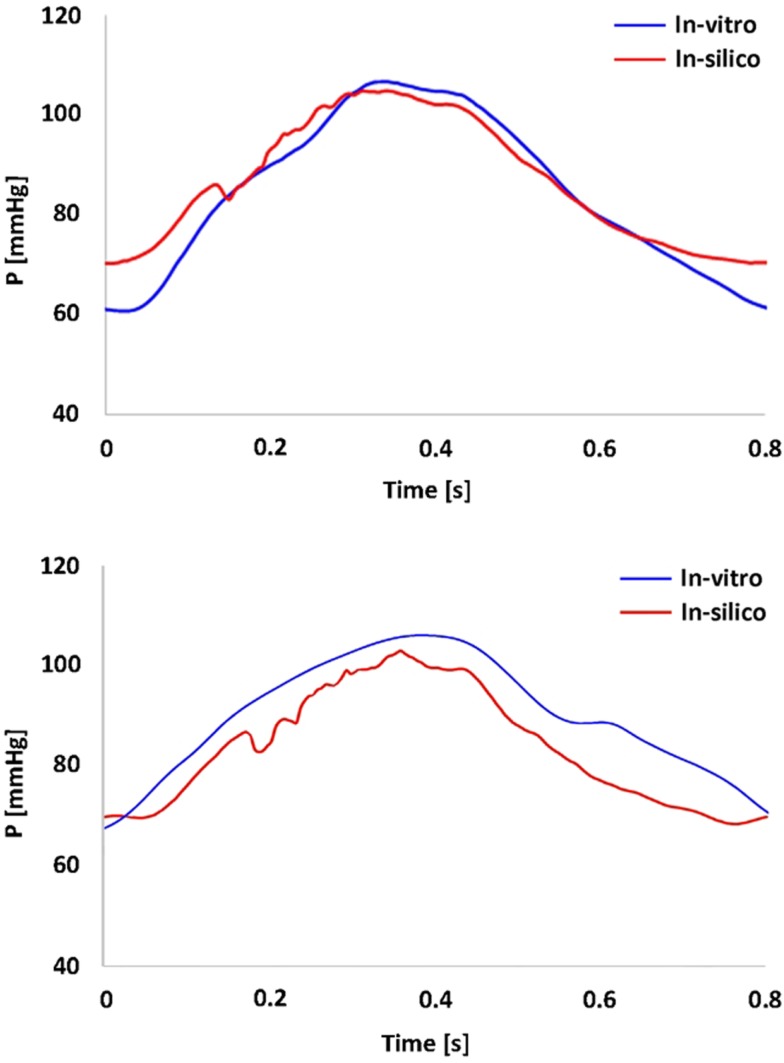
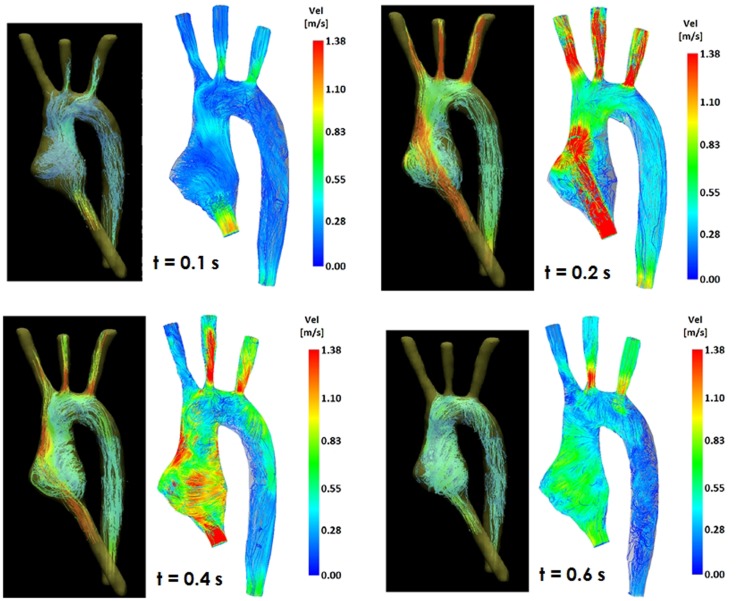
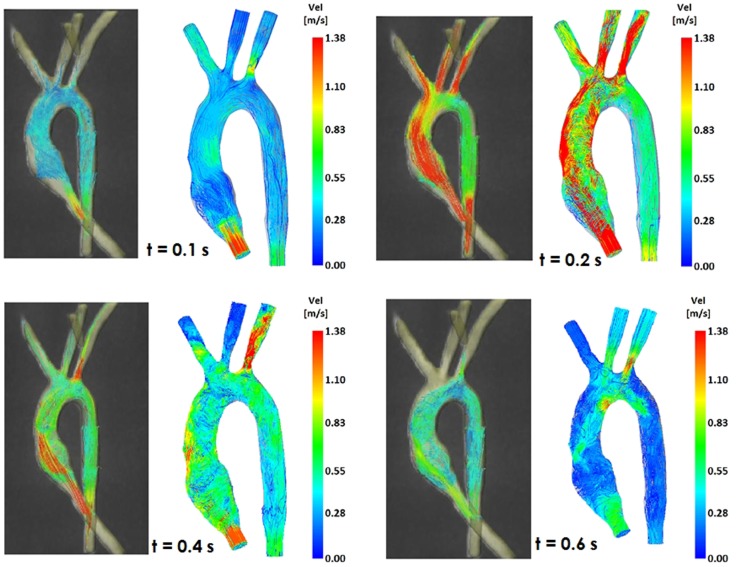
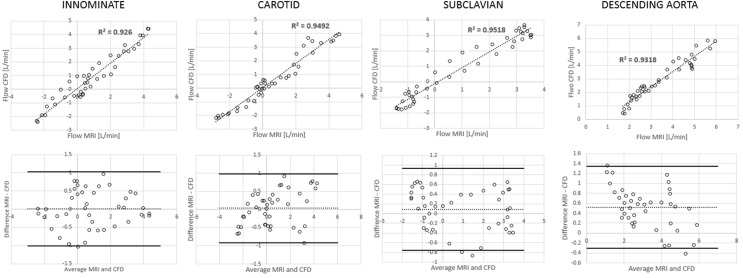
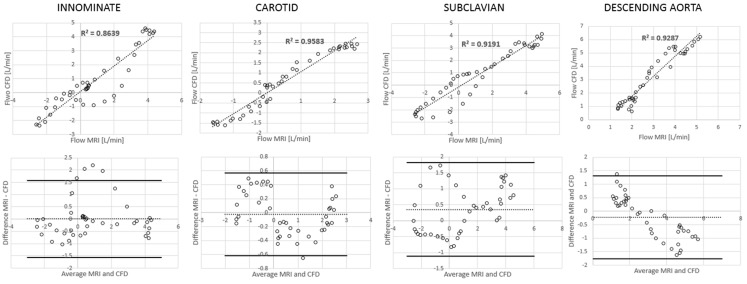
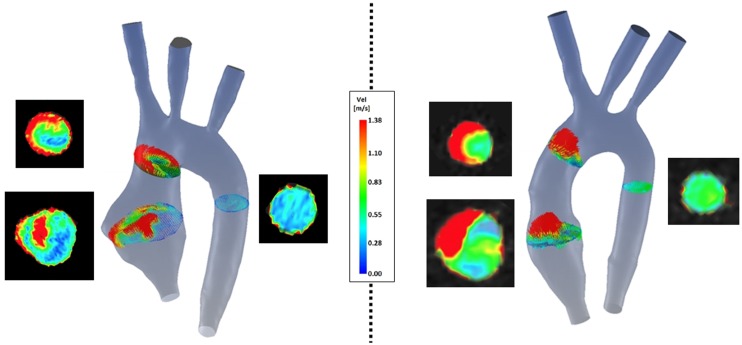
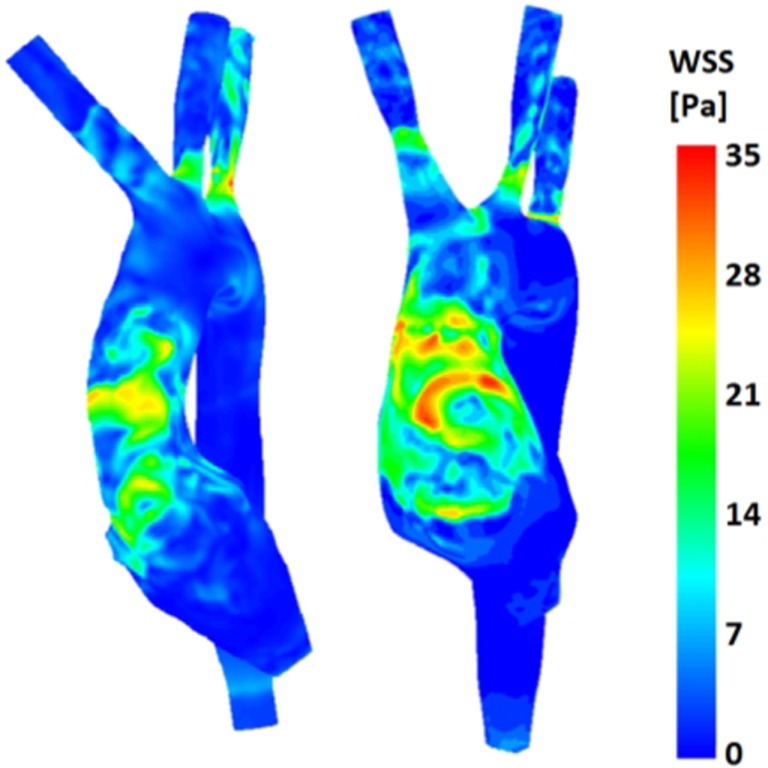
Computational fluid dynamics (CFD) can have a complementary predictive role alongside the exquisite visualization capabilities of 4D cardiovascular magnetic resonance (CMR) imaging. In order to exploit these capabilities (e.g., for decision-making), it is necessary to validate computational models against real world data. In this study, we sought to acquire 4D CMR flow data in a controllable, experimental setup and use these data to validate a corresponding computational model. We applied this paradigm to a case of congenital heart disease, namely, transposition of the great arteries (TGA) repaired with arterial switch operation. For this purpose, a mock circulatory loop compatible with the CMR environment was constructed and two detailed aortic 3D models (i.e., one TGA case and one normal aortic anatomy) were tested under realistic hemodynamic conditions, acquiring 4D CMR flow. The same 3D domains were used for multi-scale CFD simulations, whereby the remainder of the mock circulatory system was appropriately summarized with a lumped parameter network. Boundary conditions of the simulations mirrored those measured in vitro. Results showed a very good quantitative agreement between experimental and computational models in terms of pressure (overall maximum % error = 4.4% aortic pressure in the control anatomy) and flow distribution data (overall maximum % error = 3.6% at the subclavian artery outlet of the TGA model). Very good qualitative agreement could also be appreciated in terms of streamlines, throughout the cardiac cycle. Additionally, velocity vectors in the ascending aorta revealed less symmetrical flow in the TGA model, which also exhibited higher wall shear stress in the anterior ascending aorta.
Keywords: cardiovascular magnetic resonance imaging; congenital heart disease; mock circulatory loop; rapid prototyping; validation.
Figures
References
-
- Valverde I, Nordmeyer S, Uribe S, Greil G, Berger F, Kuehne T, et al. Systemic-to-pulmonary collateral flow in patients with palliated univentricular heart physiology: measurement using cardiovascular magnetic resonance 4D velocity acquisition. J Cardiovasc Magn Reson (2012) 14:25.10.1186/1532-429X-14-25 - DOI - PMC - PubMed
-
- Francois CJ, Srinivasan S, Schiebler ML, Reeder SB, Niespodzany E, Landgraf BR, et al. 4D cardiovascular magnetic resonance velocity mapping of alterations of right heart flow patterns and main pulmonary artery hemodynamics in tetralogy of Fallot. J Cardiovasc Magn Reson (2012) 14:16.10.1186/1532-429X-14-16 - DOI - PMC - PubMed
-
- Carlsson M, Toger J, Kanski M, Bloch KM, Stahlberg F, Heiberg E, et al. Quantification and visualization of cardiovascular 4D velocity mapping accelerated with parallel imaging or k-t BLAST: head to head comparison and validation at 1.5T and 3T. J Cardiovasc Magn Reson (2011) 13:55.10.1186/1532-429X-13-55 - DOI - PMC - PubMed
Grants and funding
LinkOut - more resources
Full Text Sources
Other Literature Sources
Miscellaneous