. 2015;14(24):3908-19.
doi: 10.1080/15384101.2015.1120920.

Gamma-actin is involved in regulating centrosome function and mitotic progression in cancer cells

Affiliations

Gamma-actin is involved in regulating centrosome function and mitotic progression in cancer cells

Sela T Po'uha et al. Cell Cycle. 2015.

Abstract

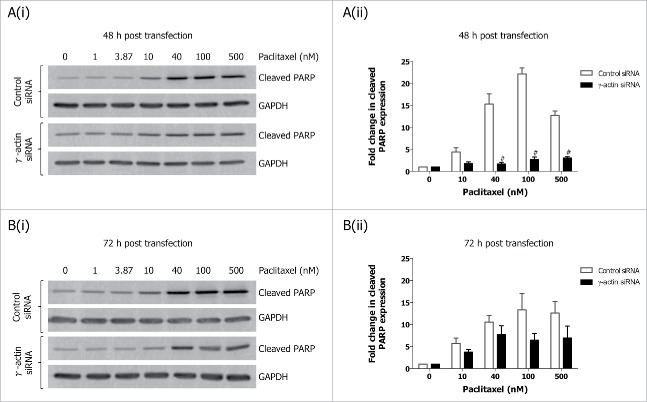
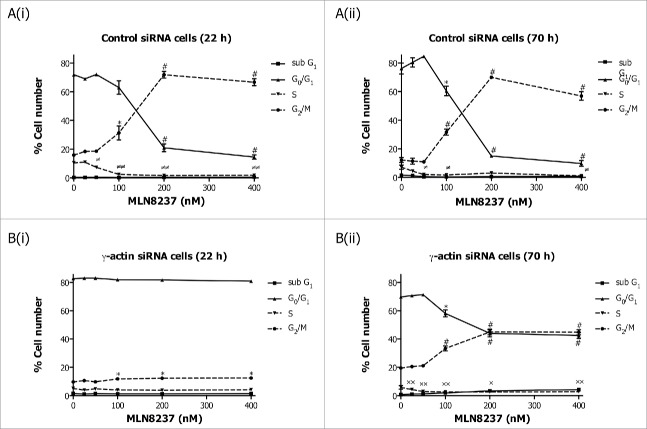
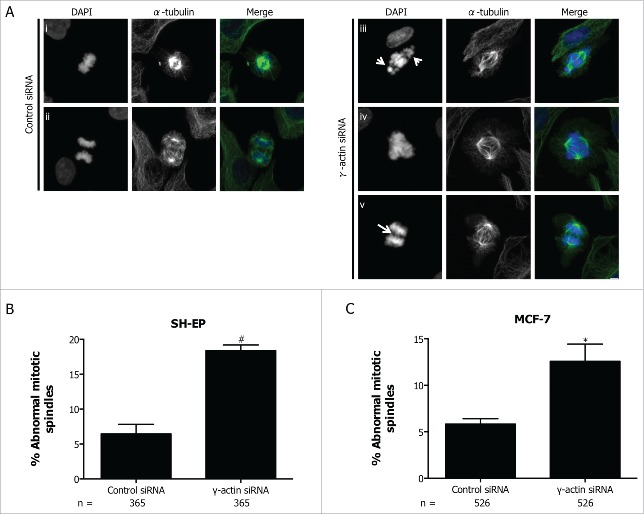
Reorganization of the actin cytoskeleton during mitosis is crucial for regulating cell division. A functional role for γ-actin in mitotic arrest induced by the microtubule-targeted agent, paclitaxel, has recently been demonstrated. We hypothesized that γ-actin plays a role in mitosis. Herein, we investigated the effect of γ-actin in mitosis and demonstrated that γ-actin is important in the distribution of β-actin and formation of actin-rich retraction fibers during mitosis. The reduced ability of paclitaxel to induce mitotic arrest as a result of γ-actin depletion was replicated with a range of mitotic inhibitors, suggesting that γ-actin loss reduces the ability of broad classes of anti-mitotic agents to induce mitotic arrest. In addition, partial depletion of γ-actin enhanced centrosome amplification in cancer cells and caused a significant delay in prometaphase/metaphase. This prolonged prometaphase/metaphase arrest was due to mitotic defects such as uncongressed and missegregated chromosomes, and correlated with an increased presence of mitotic spindle abnormalities in the γ-actin depleted cells. Collectively, these results demonstrate a previously unknown role for γ-actin in regulating centrosome function, chromosome alignment and maintenance of mitotic spindle integrity.

Keywords: abnormal mitotic spindles; centrosome amplification; mitosis; mitotic abnormalities; mitotic progression; γ-actin.


Figures

Figure 1.
Figure 1.
Spatial distribution of β-actin and γ-actin in different mitotic phases. Confocal images of SH-EP cells transfected with either the control or γ-actin siRNA in interphase (A and B), prometaphase (C and D), metaphase (E and F), anaphase (G and H) and telophase (I and J). The cells were dual stained for β-actin (green) or γ-actin (red). Confocal images show maximum projections and images were acquired using the same settings and process exactly the same using the ZEN software. Scale bar, 5 µm.
Figure 2.
Figure 2.
Aberrant expression of cell cycle markers in the γ-actin-depleted cells. The SH-EP GFP-β-Itubulin cells were transfected with either the control or γ-actin siRNA and treated with 0–10 nM paclitaxel for 22 or 70 h to investigate the cell cycle. Aliquots of the cells were taken for flow cytometry to confirm that paclitaxel induces G2/M cell cycle checkpoint and the rest of the cells were lysed for western blot analysis. (A) Cell cycle analysis of the control and γ-actin siRNA transfectants treated with 0–10 nM paclitaxel for either 22 or 70 h. (B) Representative western blot analyses showing the expression of several cell cycle markers, cyclin A, cyclin B1, cylin D1, cyclin E and securin, in control and γ-actin siRNA transfected cells. γ-Actin was included to confirm γ-actin knockdown and GAPDH was included as a control for equal loading. Graphs showing the relative expression of cyclin D1 (C) and cyclin E (D) in control and γ-actin siRNA transfected cells. Data are mean ± SEM of at least 3 independent experiments. *P < 0 .05, #P < 0 .005, statistically significant between the drug free γ-actin siRNA cells and drug free control siRNA cells or between the drug treated cells and its corresponding drug free cells.
Figure 3.
Figure 3.
Decreased expression of cleaved PARP in paclitaxel-treated γ-actin-depleted cells. Western blotting analysis of cleaved PARP expression performed on lysates from SH-EP GFP-β-Itubulin siRNA transfected cells, treated with 0–500 nM paclitaxel for 48 h to induce cell death, following either 48 (A) or 72 h (B) siRNA transfection. Both floating and adherence cells were collected for western blot analysis. GAPDH was included as a control for equal loading. Graphs represent the fold change in cleaved PARP expression. Data are mean ± SEM of 3 independent experiments. #P < 0 .005, statistically significant when comparing the γ-actin siRNA cells to the control siRNA cells.
Figure 4.
Figure 4.
Inhibition of Eg5 inhibitor III, dimethylenastron, induced G2/M cell cycle checkpoint in the γ-actin knockdown cells. Cell cycle analysis of SH-EP GFP-β-Itubulin cells transfected with either control (A) or γ-actin siRNA (B) and treated with 0–2 µM dimethylenastron for either 22 h (A(i) and B(i)) or 70 h (A(ii) and B(ii)). Data are mean ± SEM of 3 independent experiments.*P < 0 .05, #P < 0 .005, statistically significant between the drug treated cells and its corresponding drug free cells in G0/G1 and G2/M cell cycle phases. P < 0 .05, ≠≠P < 0 .005, statistically significant between the drug treated cells and its corresponding drug free cells in S phase. xP < 0 .05, xxP < 0 .005, statistically significant between the drug treated cells and its corresponding drug free cells in sub-G1.
Figure 5.
Figure 5.
Partial depletion of γ-actin inhibits Aurora kinase A inhibitor, MLN8273, induced G2/M cell cycle checkpoint in SH-EP cells. Cell cycle distribution in SH-EP GFP-β-Itubulin cells transfected with either the control (A) or γ-actin siRNA (B) then treated with increasing concentrations of MLN8237, for either 22 (A(i) and B(i)) or 70 h (A(ii) and B(ii)). Data are mean ± SEM of 3 independent experiments.*P < 0 .05, #P < 0 .005, statistically significant between the drug treated cells and its corresponding drug free cells in G0/G1 and G2/M cell cycle phases. P < 0 .05, ≠≠P < 0 .005, statistically significant between the drug treated cells and its corresponding drug free cells in S phase. *P < 0 .05, **P < 0 .005, statistically significant between the drug treated cells and its corresponding drug free cells in sub-G1.
Figure 6.
Figure 6.
Enhanced centrosome amplification in cancer cells due to γ-actin depletion. Quantification of centrosome numbers in the control and γ-actin siRNA transfected SH-EP (A), MCF-7 (B) and MRC-5 cells (C) were analyzed by co-staining the cells with γ-tubulin and α-tubulin. Confocal images were acquired and then centrosome number was scored in interphase cells as 1, 2 or more than 2 centrosomes. n = the total number of interphase cells analyzed from 4 independent experiments. *P < 0 .05, #P < 0 .005, statistically significant when comparing the γ-actin siRNA cells to the control siRNA cells.
Figure 7.
Figure 7.
Partial depletion of γ-actin induces mitotic defects. (A) Still images from movies in Supplemental Movie 1 and 2, showing SH-EP mCherry-histone-H2B expressing cells transfected with the control siRNA (top panels) undergoing normal mitosis or with the γ-actin siRNA (bottom panels) undergoing abnormal mitosis. Arrows showing uncongressed chromosomes. Time is in h:min:s; Scale bar, 50 µm. (B) A scatter plot showing the duration for prometaphase/metaphase in the control and γ-actin depleted cells, which was measured from nuclear envelope breakdown to the beginning of anaphase. n = the total number of mitotic cells undergoing mitosis analyzed from 3 independent experiments. #Control siRNA cells have more than 203 mitotic cells, however, we only analyzed 203 mitotic cells due to fewer mitotic cells in the γ-actin siRNA cells. Therefore the actual percentage of mitotic abnormalities for the control siRNA cells is lower than 8.37%. #P < 0 .005, statistically significant when comparing the γ-actin siRNA cells to the control siRNA cells.
Figure 8.
Figure 8.
Increased formation of abnormal mitotic spindles in the γ-actin knockdown cells. (A) Confocal images of normal mitotic spindles in control siRNA SH-EP cells (i-ii) and abnormal mitotic spindles in γ-actin siRNA SH-EP cells (iii-v). Cells were stained with α-tubulin to visualize the mitotic spindles and counterstained with DAPI to visualize the chromosomes. Arrows in (iii) shows uncongressed chromosomes in metaphase and arrow in (v) shows anaphase bridge. Confocal images show maximum projections. Scale bar, 5 µm. Quantification of abnormal spindle mitoses in SH-EP (B) and MCF-7 (C) cells transfected with either the control or γ-actin siRNA. The types of mitotic cells that were counted include prometaphase, metaphase, anaphase and telophase. n=the total number of mitotic cells analyzed per condition. Data are mean ± SEM of 3 independent experiments. *P < 0 .05, #P <0 .005, statistically significant when comparing the γ-actin siRNA cells to the control siRNA cells.

Comment in

Similar articles

Cited by

References

    1. Heng YW, Koh CG. Actin cytoskeleton dynamics and the cell division cycle. Int J Biochem Cell Biol 2010; 42:1622-33; PMID:20412868; http://dx.doi.org/ 10.1016/j.biocel.2010.04.007 - DOI - PubMed
    1. Rankin KE, Wordeman L. Long astral microtubules uncouple mitotic spindles from the cytokinetic furrow. J Cell Biol 2010; 190:35-43; PMID:20603328; http://dx.doi.org/ 10.1083/jcb.201004017 - DOI - PMC - PubMed
    1. Palmer RE, Sullivan DS, Huffaker T, Koshland D. Role of astral microtubules and actin in spindle orientation and migration in the budding yeast, Saccharomyces cerevisiae. J Cell Biol 1992; 119:583-93; PMID:1400594; http://dx.doi.org/ 10.1083/jcb.119.3.583 - DOI - PMC - PubMed
    1. Sandquist JC, Kita AM, Bement WM. And the dead shall rise: actin and myosin return to the spindle. Dev Cell 2011; 21:410-9; PMID:21920311; http://dx.doi.org/ 10.1016/j.devcel.2011.07.018 - DOI - PMC - PubMed
    1. Weber KL, Sokac AM, Berg JS, Cheney RE, Bement WM. A microtubule-binding myosin required for nuclear anchoring and spindle assembly. Nature 2004; 431:325-9; PMID:15372037; http://dx.doi.org/ 10.1038/nature02834 - DOI - PubMed

Publication types