Defective PITRM1 mitochondrial peptidase is associated with Aβ amyloidotic neurodegeneration
- PMID: 26697887
- PMCID: PMC4772954
- DOI: 10.15252/emmm.201505894
Defective PITRM1 mitochondrial peptidase is associated with Aβ amyloidotic neurodegeneration
Abstract
Mitochondrial dysfunction and altered proteostasis are central features of neurodegenerative diseases. The pitrilysin metallopeptidase 1 (PITRM1) is a mitochondrial matrix enzyme, which digests oligopeptides, including the mitochondrial targeting sequences that are cleaved from proteins imported across the inner mitochondrial membrane and the mitochondrial fraction of amyloid beta (Aβ). We identified two siblings carrying a homozygous PITRM1 missense mutation (c.548G>A, p.Arg183Gln) associated with an autosomal recessive, slowly progressive syndrome characterised by mental retardation, spinocerebellar ataxia, cognitive decline and psychosis. The pathogenicity of the mutation was tested in vitro, in mutant fibroblasts and skeletal muscle, and in a yeast model. A Pitrm1(+/-) heterozygous mouse showed progressive ataxia associated with brain degenerative lesions, including accumulation of Aβ-positive amyloid deposits. Our results show that PITRM1 is responsible for significant Aβ degradation and that impairment of its activity results in Aβ accumulation, thus providing a mechanistic demonstration of the mitochondrial involvement in amyloidotic neurodegeneration.
Keywords: amyloid beta; mitochondrial disease; mitochondrial targeting sequence; neurodegeneration; pitrilysin 1.
© 2015 The Authors. Published under the terms of the CC BY 4.0 license.
Figures
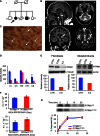
Family tree. Affected subjects are represented by filled shapes. The index case is
II ‐2 (arrow).Brain
MRI images ofII ‐1 (FLAIR ). A: (a) sagittal interemispheric sequence showing profound cerebellar atrophy (arrow); (b) transverse sequence showing involvement of the dentate nuclei of cerebellum; (c) coronal sequence revealing cortical atrophy, a wide third ventricle, and high signal changes in the thalami, particularly on the left (arrow); (d) the thalamic lesion is indicated by an arrow.Histochemical staining of skeletal muscle from
II ‐2. CombinedCOX /SDH staining shows scatteredCOX ‐negative (blue) fibres (arrows). Scale bar corresponds to 100 μm.Respiratory chain complex activities in skeletal muscle. Specific activities (nmol/min/mg) of complex I,
II andIV are reduced inII ‐2 (red) compared to the controls mean (blue);CS activity is also low (< 50% of controls), suggesting a reduction in mitochondrial mass (see main text for further details). Each activity was measured in triplicate.Western blot analysis of
PITRM 1 in primary fibroblasts (left) and skeletal muscle (right) of controls (CTR ) and subjectII ‐2. Densitometric quantification using the Genetools software is shown below the blots. In blue isPITRM 1WT and in redPITRM 1R183Q.Proteolytic activity on two fluorescent oligopeptides (AnaSpec), reported at the bottom of each histogram, by 6‐His‐tagged
PITRM 1WT andPITRM 1R183Q proteins expressed in E. coli and affinity‐purified by Ni‐agarose chromatography. Values are expressed as arbitrary units per sec per μg of protein (a.u./s/μg). Experiments were performed in duplicate.Degradation rate of Aβ1–42 by purified 6‐His‐tagged
PITRM 1WT andPITRM 1R183Q proteins. Quantification of these experiments is displayed below the blots. Experiments were performed in duplicate.
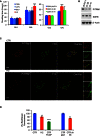
Cell growth in glucose (
GLU ) and galactose (GAL ). C29V, C47V and TpLV : immortalised fibroblast cell lines from control individuals;PITRM 1V: immortalised fibroblasts from subjectII ‐2, carrying thePITRM 1 R183Q mutation.pLKO .1: empty vector; sh38: shRNA 38; sh41: shRNA 41. Each cell line was measured six times. Statistical analysis was performed using two‐wayANOVA post hoc Bonferroni test, ***P < 0.001.Western blot analysis of
PITRM 1 in C29V cells transduced with the empty vector plKO .1 and the two shRNA s, sh38 and sh41.SDHB and β‐actin are used as loading controls.Co‐localisation of
PITRM 1 (red) withTOM 20 (T20, green) in human fibroblast cells from a control (CTR ) and subjectII ‐2. Note that the intensity ofPITRM 1 immunofluorescence is much lower inII ‐2 cells than inCTR cells (see main text for further details). Nuclei are stained in blue byDAPI . Scale bar corresponds to 10 μm.Mitochondrial membrane potential (ΔP). In healthy cells with high mitochondrial ΔP,
JC ‐1 forms complexes known as J‐aggregates that show an intense red fluorescence. On the contrary in unhealthy cells with low ΔP,JC ‐1 remains in the monomeric form, showing only green fluorescence. Values are referred to as % of those of the control means, taken as 100%. The results are the mean of three independent experiments. Statistical analysis was performed using two‐wayANOVA , **P < 0.01; ****P < 0.0001.
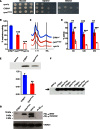
Oxidative growth. W303‐1B cym1Δ strains harbouring the wild‐type
CYM 1 allele (CYM 1 wt), the cym1 R163Q mutant allele or the empty vector were serially diluted from 107 to 104 cells/ml. Five microlitres of each dilution was spotted onSC agar plates without uracil, supplemented with 2% glucose, 2% glycerol or 2% ethanol. Plates were incubated at 37°C for 3–7 days.Oxygen consumption rate (
OCR ). Cells grown at 37°CSC medium without uracil were supplemented with 0.5% glucose. Values were normalised to theOCR of theCYM 1 wt strain (49 nmol O2/min/mg) and represented as the mean of at least three values ±SD .Reduced versus oxidised cytochrome spectra. Peaks at 550, 560 and 602 nm correspond to cytochromes c, b and aa3, respectively. The height of each peak relative to the baseline is an index of cytochrome content.
Respiratory chain complex activities. Biochemical activities of succinate quinone
DCPIP reductase,SQDR (CII ),NADH ‐cytochrome c oxidoreductase activityNCCR (CIII ) and cytochrome c oxidase (CIV ) were measured on a mitochondrial enriched fraction from cells grown at 37°C as in (B). Values were normalised to that ofCYM 1 wt strain and represented as the mean of three independent experiments ±SD .Western blot on total protein extract using an anti‐
HA monoclonal antibody visualising theCYM 1wt and cym1R163Q recombinant proteins both fused in frame with theHA epitope on the C‐terminus. Total protein extracts were obtained by strains expressingHA ‐taggedCYM 1 wt and cym1 R163Q.PGK was used as a loading control, and signals were normalised to the wt. The quantification was performed on five independent blots.Prolonged exposure of a Western blot containing the
CYM 1wt and cym1R163Q recombinant proteins reveals the presence of a band corresponding to a degradation product in the cym1R163Q lanes (arrow).Western blot of Aβ1–42 myc monomer and dimer incubated with purified mitochondrial extracts from cells grown at 37°C in
SC medium supplemented with 0.15% glucose and 2% galactose.VDAC was used as a loading control. Each experiment was performed in triplicate.
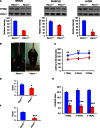
- A
Western blot analysis of Pitrm1 protein in brain, muscle and liver of two 4‐mo male Pitrm1 +/− mice and two Pitrm1 +/+ littermates. Densitometric analysis is reported in the histograms below the blots. Pitrm1 +/+ is in blue and Pitrm1 +/− in red.
- B
Representative hindlimb clasping phenomenon is shown in a 4‐mo Pitrm1 +/− male mouse, consisting in strong adduction of the hindlimbs when the animal is suspended by the tail; a littermate Pitrm1 +/+ control displays the normal reflex, consisting in wide abduction of the limbs. All examined Pitrm1 +/− animals displayed this abnormal reflex from 2 months of age.
- C
Rotarod test. Blue and red lines refer to Pitrm1 +/+ (n = 9) and Pitrm1 +/− (n = 7) 4‐mo animals, respectively.
- D–F
Negative geotaxis (D), cylinder (E) and pole (F) tests. The experiments were carried out on the same group of animals as in (B).
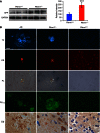
Western blot analysis of amyloid precursor protein (
APP ) in 6‐mo male mice.GAPDH was used as a loading control. Densitometric analysis on a total of five independent samples is shown in the histogram on the right. ***P = 0.00058. Data are presented as mean ± SD. Statistical analysis was performed using unpaired, two‐tailed Student's t‐test.Morphological analysis of an
AD subject and of Pitrm1 +/− and Pitrm1 +/+ mouse brains.TF : thioflavin T (thalamus);CR : Congo red (brain cortex);PL : polarised light (same sections as those stained withCR ); Aβ1–42 immunostaining (pons); Ub: ubiquitin immunohistochemistry shown as brownish staining (brain cortex). Scale bar indicates 20 μm.

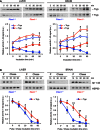
Upper panel: import of Aβ1–42 into mitochondria. Lower panel: relative quantification from two independent experiments. Values of Aβ1–42 signal were normalised to
HSP 60 signal, and the resulting value at 5 min without trypsin was arbitrarily set as 1.Upper panel: pulse and chase experiment to assess clearance of Aβ1–42; lower panel: quantification from three independent experiments. Values of Aβ1–42 signal were normalised to
HSP 60 signal, and the pulse value was arbitrarily chosen as 1.
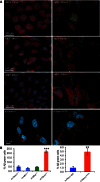
MEF s from Pitrm1 +/+, Pitrm1 +/−, Mfn1 −/− and Mfn2 −/−, as well as h‐PITRM 1 R183Q and h‐PITRM 1WT , were exposed to Aβ1–40 peptide for 18 h. Note that Aβ1–40 signal was still evident in Pitrm1 +/− and h‐PITRM 1 R183Q cells.Quantification of three independent experiments similar to those shown in (A). Data are presented as mean ±
SD . Statistical analysis was by unpaired, two‐tailed Student's t‐test. **P < 0.01, ***P < 0.001. Exact P‐values are reported in Table EV1.
Comment in
-
Amyloid-β in mitochondrial disease: mutation in a human metallopeptidase links amyloidotic neurodegeneration with mitochondrial processing.EMBO Mol Med. 2016 Mar 1;8(3):173-5. doi: 10.15252/emmm.201506050. EMBO Mol Med. 2016. PMID: 26813924 Free PMC article.
References
-
- Alikhani N, Berglund AK, Engmann T, Spanning E, Vogtle FN, Pavlov P, Meisinger C, Langer T, Glaser E (2011a) Targeting capacity and conservation of PreP homologues localization in mitochondria of different species. J Mol Biol 410: 400–410 - PubMed
-
- Andreasen N, Hesse C, Davidsson P, Minthon L, Wallin A, Winblad B, Vanderstichele H, Vanmechelen E, Blennow K (1999) Cerebrospinal fluid beta‐amyloid(1‐42) in Alzheimer disease: differences between early‐ and late‐onset Alzheimer disease and stability during the course of disease. Arch Neurol 56: 673–680 - PubMed
-
- Brunetti D, Dusi S, Giordano C, Lamperti C, Morbin M, Fugnanesi V, Marchet S, Fagiolari G, Sibon O, Moggio M et al (2014) Pantethine treatment is effective in recovering the disease phenotype induced by ketogenic diet in a pantothenate kinase‐associated neurodegeneration mouse model. Brain 137: 57–68 - PMC - PubMed
-
- Burns J, Pennock CA, Stoward PJ (1967) The specificity of the staining of amyloid deposits with thioflavine T. J Pathol Bacteriol 94: 337–344 - PubMed
Publication types
MeSH terms
Substances
Grants and funding
LinkOut - more resources
Full Text Sources
Other Literature Sources
Medical
Molecular Biology Databases

