. 2016 Jan;23(1):228-37.
doi: 10.1107/S1600577515019700. Epub 2016 Jan 1.

Imperfection and radiation damage in protein crystals studied with coherent radiation

Affiliations

Imperfection and radiation damage in protein crystals studied with coherent radiation

Colin Nave et al. J Synchrotron Radiat. 2016 Jan.

Abstract

Fringes and speckles occur within diffraction spots when a crystal is illuminated with coherent radiation during X-ray diffraction. The additional information in these features provides insight into the imperfections in the crystal at the sub-micrometre scale. In addition, these features can provide more accurate intensity measurements (e.g. by model-based profile fitting), detwinning (by distinguishing the various components), phasing (by exploiting sampling of the molecular transform) and refinement (by distinguishing regions with different unit-cell parameters). In order to exploit these potential benefits, the features due to coherent diffraction have to be recorded and any change due to radiation damage properly modelled. Initial results from recording coherent diffraction at cryotemperatures from polyhedrin crystals of approximately 2 µm in size are described. These measurements allowed information about the type of crystal imperfections to be obtained at the sub-micrometre level, together with the changes due to radiation damage.

Keywords: coherent diffraction; crystal perfection; radiation damage.


Figures

Figure 1
Figure 1
Representative diffraction spots obtained on the PILATUS detector at 12.6 Å resolution (left) and 70.1 Å resolution (110 reflection right) obtained from the same image but not necessarily the same crystal. Pixel dimensions 170 µm × 170 µm.
Figure 2
Figure 2
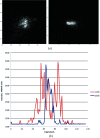
(a) Two diffraction spots from different crystals obtained from the ANDOR detector at 12.6 Å resolution (left) and 25.6 Å resolution (400 reflection right). (b) Vertical profiles obtained from the diffraction spots in (a). For the detector signal, in ANDOR units, the intensity offset from zero is approximately 1160, and one photon, centred over a pixel, gives a signal of approximately 520.
Figure 3
Figure 3
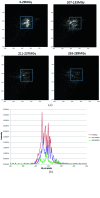
(a) Changes in the details of a diffraction spot with dose. The blue box corresponds to a pixel on the PILATUS detector at 300 mm distance and is retained in the same position to illustrate the shift in the centre of the diffraction spot with exposure. The dose figures correspond to the estimates for the start and end of each 20 s exposure. (b) Vertical profiles of diffraction spots shown in (a). These were summed across 20 horizontal pixels to compensate for the weaker intensities and noisier data at higher dose. In this plot the detector offset has been subtracted.
Figure 4
Figure 4
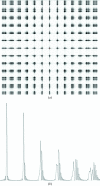
(a) Simulation of coherent diffraction from a two-dimensional crystal with 21 × 21 lattice points and a continuous variation in cell dimensions. The distance between lattice points varies uniformly in each direction from 99 Å at the lattice point at the centre of the crystal to 90 Å at the edge. (b) Profile of the reflections from (a). The h,k = 0,0 to 0,5 reflections are shown.
Figure 5
Figure 5
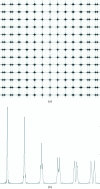
(a) Simulation of coherent diffraction from a crystal consisting of two adjacent domains with different cell dimensions. The domains are separated in the b (horizontal) direction. One domain consists of 20 × 10 lattice points with lattice dimensions a = b = 99 Å. The second domain consisted of 20 × 10 lattice points with a = 99, b = 95 Å. (b) Profile of the reflections from (a). The h,k = 0,0 to 0,5 reflections are shown.
Figure 6
Figure 6
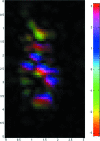
Reconstruction of crystal obtained from the reflection at 12.6 Å shown in Fig. 2 ▸(a). In this representation, the brightness corresponds to the amplitude (black 0, brightest maximum) and the rainbow colour to the phase (from −π to +π) across the crystal. A perfect crystal would have a uniform amplitude and phase and, therefore, a constant colour of uniform brightness.

References

    1. Aranda, M. A. G., Berenguer, F., Bean, R. J., Shi, X., Xiong, G., Collins, S. P., Nave, C. & Robinson, I. K. (2010). J. Synchrotron Rad. 17, 751–760. - PubMed
    1. Boggon, T. J., Helliwell, J. R., Judge, R. A., Olczak, A., Siddons, D. P., Snell, E. H. & Stojanoff, V. (2000). Acta Cryst. D56, 868–880. - PubMed
    1. Boutet, S. & Robinson, I. K. (2008). J. Synchrotron Rad. 15, 576–583. - PubMed
    1. Bowler, M. W., Guijarro, M., Petitdemange, S., Baker, I., Svensson, O., Burghammer, M., Mueller-Dieckmann, C., Gordon, E. J., Flot, D., McSweeney, S. M. & Leonard, G. A. (2010). Acta Cryst. D66, 855–864. - PubMed
    1. Chamard, V., Allain, M., Godard, P., Talneau, A., Patriarche, G. & Burghammer, M. (2015). Sci. Rep. 5, 9827. - PMC - PubMed

MeSH terms