

Mechanism governing heme synthesis reveals a GATA factor/heme circuit that controls differentiation
- PMID: 26698166
- PMCID: PMC5290819
- DOI: 10.15252/embr.201541465
Mechanism governing heme synthesis reveals a GATA factor/heme circuit that controls differentiation
Abstract
Metal ion-containing macromolecules have fundamental roles in essentially all biological processes throughout the evolutionary tree. For example, iron-containing heme is a cofactor in enzyme catalysis and electron transfer and an essential hemoglobin constituent. To meet the intense demand for hemoglobin assembly in red blood cells, the cell type-specific factor GATA-1 activates transcription of Alas2, encoding the rate-limiting enzyme in heme biosynthesis, 5-aminolevulinic acid synthase-2 (ALAS-2). Using genetic editing to unravel mechanisms governing heme biosynthesis, we discovered a GATA factor- and heme-dependent circuit that establishes the erythroid cell transcriptome. CRISPR/Cas9-mediated ablation of two Alas2 intronic cis elements strongly reduces GATA-1-induced Alas2 transcription, heme biosynthesis, and surprisingly, GATA-1 regulation of other vital constituents of the erythroid cell transcriptome. Bypassing ALAS-2 function in Alas2 cis element-mutant cells by providing its catalytic product 5-aminolevulinic acid rescues heme biosynthesis and the GATA-1-dependent genetic network. Heme amplifies GATA-1 function by downregulating the heme-sensing transcriptional repressor Bach1 and via a Bach1-insensitive mechanism. Through this dual mechanism, heme and a master regulator collaborate to orchestrate a cell type-specific transcriptional program that promotes cellular differentiation.
Keywords: Bach1; GATA factor; heme; network; transcriptome.
© 2015 The Authors.
Figures
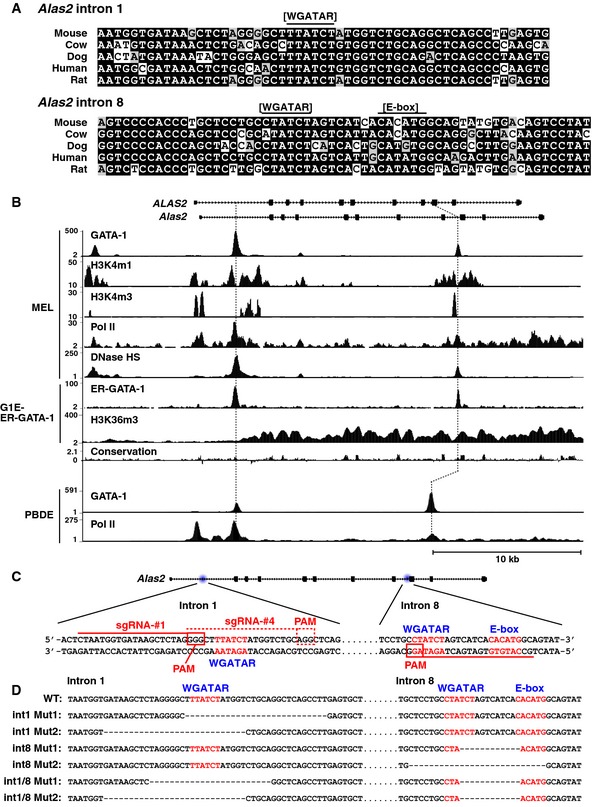
Sequence alignment of GATA and E‐box motifs in Alas2 intron 1 or 8 demonstrating conservation among mammals.
DNase hypersensitivity and ChIP‐seq profiles for GATA‐1 or Pol II occupancy and histone modifications at Alas2 and ALAS2 (accession numbers: GSM912907, GSM912895, GSM1003744, GSM1003753, GSM1014191, GSM923572, GSM946526, GSM935465, and GSM935462).
CRISPR/Cas9 strategy to delete GATA motifs in intron 1 or 8 of Alas2 gene in G1E‐ER‐GATA‐1 cells. PAM: Protospacer adjacent motif.
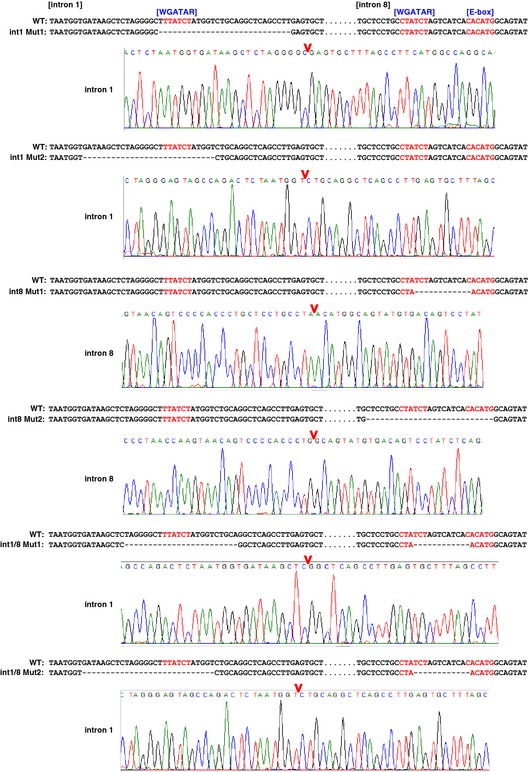
DNA sequences at Alas2 introns of wild‐type (WT) and mutant clones.
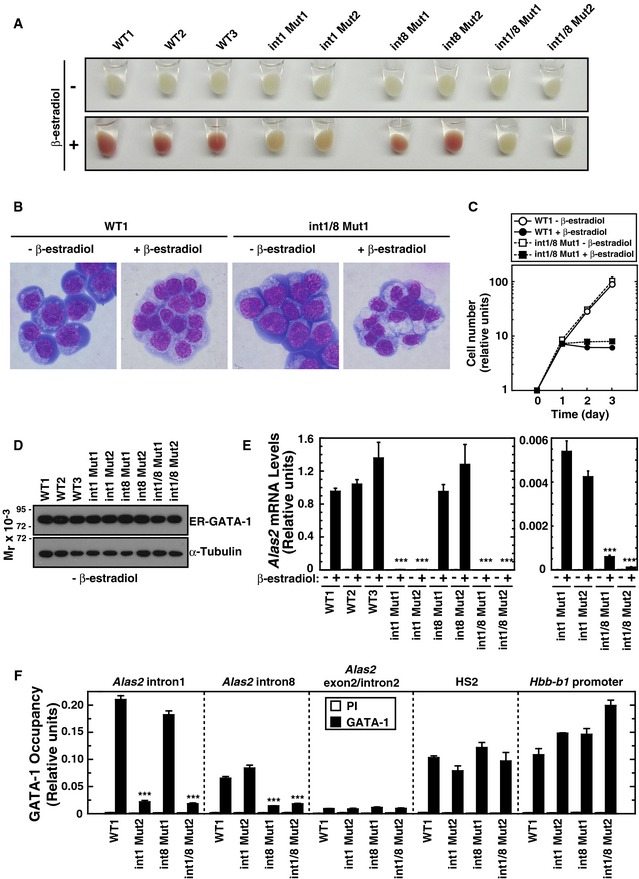
Representative pellets of WT and mutant G1E‐ER‐GATA‐1 cell clones treated with or without β‐estradiol for 48 h.
Wright–Giemsa staining of untreated and β‐estradiol‐treated (48 h) WT clone 1 (WT1) as well as double‐mutant clone 1 (int1/8 Mut1).
Growth curves in WT1 and double‐mutant clone 1 cells treated with or without β‐estradiol (n = 3, mean ± SE).
Western blotting of ER‐GATA‐1 and α‐tubulin in WT and mutant clones.
Real‐time RT–PCR of Alas2 mRNA in untreated or β‐estradiol‐treated WT and mutant clones. ***P < 0.001 with respect to all values of WT1‐3 (n = 4, mean ± SE) (left panel). Alas2 mRNA in intron 1 mutant clones was compared to that in intron 1/8 double‐mutant clones. ***P < 0.001 with respect to all values of intron 1 mutants 1 and 2 (right panel).
Quantitative ChIP analysis of ER‐GATA‐1 occupancy at the GATA sites of Alas2 introns, HS2 of the β‐globin locus control region, and the Hbb‐b1 promoter in WT clone 1 and mutant clones. Alas2 exon 2/intron 2 junction site was used as a negative control. ***P < 0.001 with respect to WT1 (n = 4, mean ± SE).
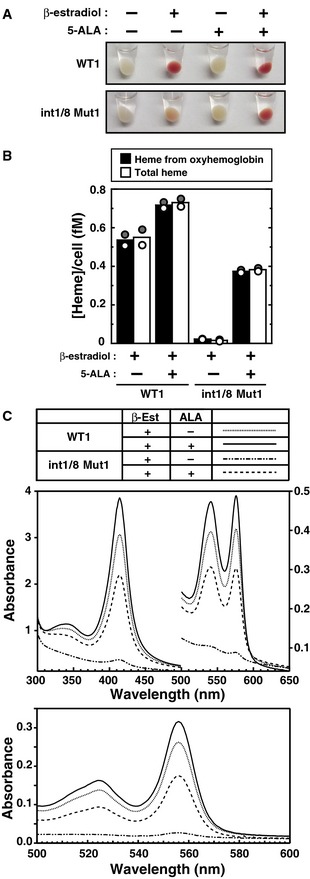
Representative cell pellets of untreated or β‐estradiol‐treated (48 h) WT clone 1 and double‐mutant clone 1, incubated with or without 5‐ALA.
Concentration of heme per cell expressed in femtomolar (fM) quantities. The concentration of heme from oxyhemoglobin was quantitated using known extinction coefficients for human hemoglobin monomers. The total heme concentration was quantified using the pyridine hemochrome assay (n = 2; bars show the mean; individual data points are shown; each data point was based on two measurements).
Visible absorption spectra of cleared cytosolic fraction (upper panel) and the pyridine hemochromogen (lower panel) of β‐estradiol‐treated WT clone 1 or double‐mutant clone 1, incubated with or without 5‐ALA.
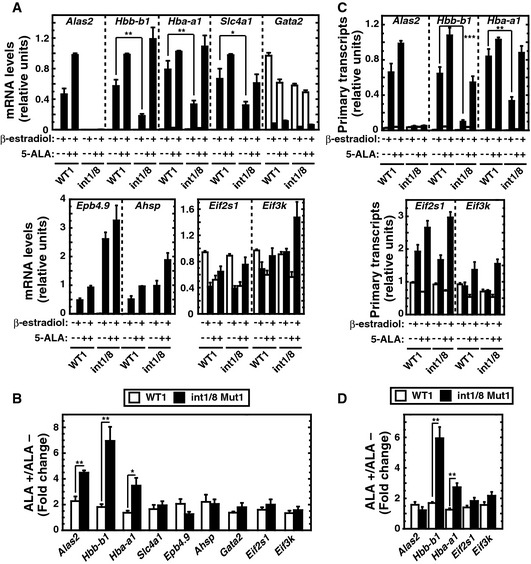
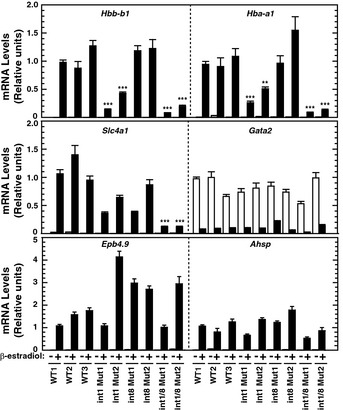
Real‐time RT–PCR analysis of mRNA levels of ER‐GATA‐1 target genes and two housekeeping genes, Eif2s1 and Eif3k (n = 4, mean ± SE).
Fold changes of mRNA levels after 5‐ALA treatment relative to no treatment in β‐estradiol‐treated WT clone 1 or double‐mutant clone 1 (n = 4, mean ± SE).
Real‐time RT–PCR analysis of primary transcripts of ER‐GATA‐1 target genes (n = 4, mean ± SE).
Fold changes of primary transcripts with 5‐ALA treatment in comparison with no treatment in β‐estradiol‐treated cells (n = 4, mean ± SE).
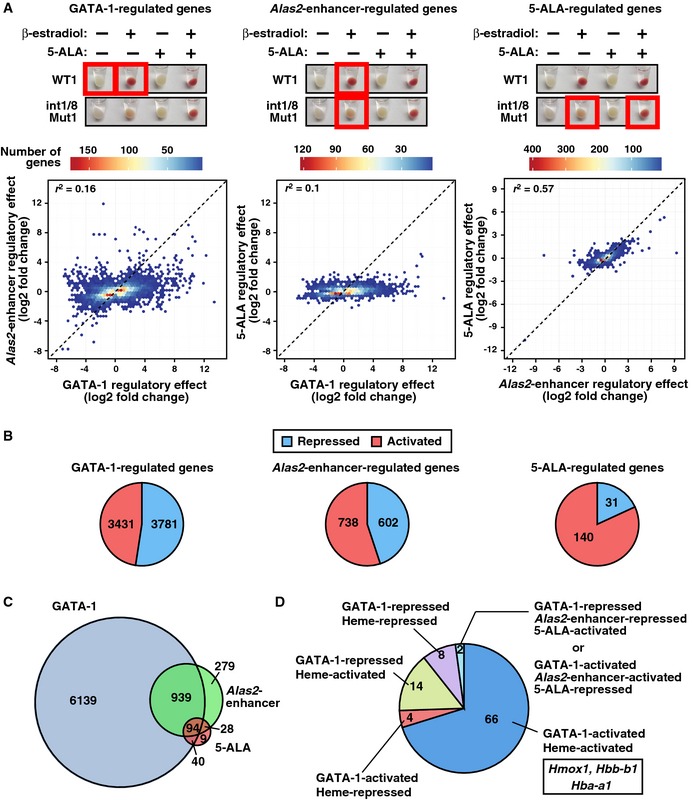
GATA‐1‐, Alas2‐enhancer‐, and 5‐ALA‐regulated genes were identified by comparing conditions depicted by red boxes. Hexbin plots comparing the regulatory effects (number of regulated genes) between GATA‐1, Alas2‐enhancer, and 5‐ALA. All upregulated genes (FDR < 0.05 and log2 fold change > 0) and downregulated genes (FDR < 0.05 and log2 fold change < 0) were tested. Coefficient of determination (r 2) was shown in each plot.
Pie charts display the percentage of activated and repressed genes (FDR < 0.05 and expressed differentially > 2‐fold) in GATA‐1‐, Alas2‐enhancer‐, or 5‐ALA‐regulated genes determined by RNA‐seq analysis.
Venn diagram depicting relationships between GATA‐1‐, Alas2‐enhancer‐, and 5‐ALA‐regulated genes.
Pie chart depicting the gene numbers in 4 categories for genes regulated by GATA‐1, Alas2‐enhancer, and 5‐ALA.
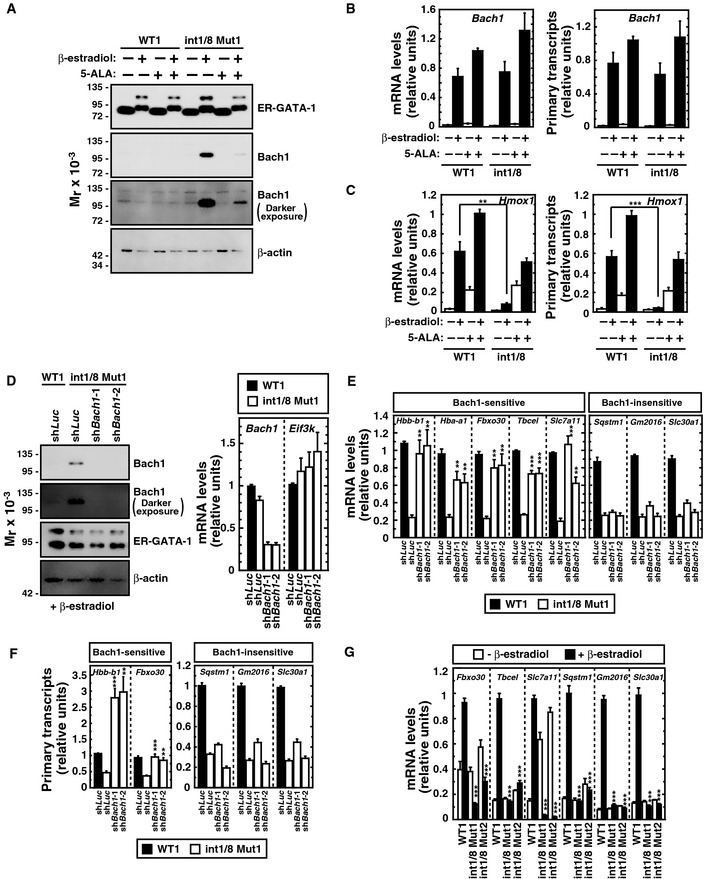
Western blot of ER‐GATA‐1, Bach1, and β‐actin in untreated or β‐estradiol‐treated (48 h) WT clone 1 and double‐mutant clone 1 incubated with or without 5‐ALA. The upper band of the ER‐GATA‐1 blot represents sumoylated ER‐GATA‐1, which increases as active ER‐GATA‐1 becomes nuclear‐localized. A darker exposure of the Bach1 blot is also shown.
Real‐time RT–PCR analysis of Bach1 mRNA levels (left panel) and primary transcripts (right panel) (n = 4, mean ± SE).
Real‐time RT–PCR quantitation of Hmox1 mRNA levels (left panel) and primary transcripts (right panel) (n = 4, mean ± SE).
Bach1 knockdown in β‐estradiol‐treated double‐mutant clone 1 (n = 4, mean ± SE). Western blot analysis of ER‐GATA‐1, Bach1, and β‐actin. A darker exposure of the Bach1 blot is also shown.
Real‐time RT–PCR analysis of mRNA levels of GATA‐1/heme‐activated genes in β‐estradiol‐treated WT1 or double‐mutant clone 1 expressing shRNA targeting Bach1. P‐values were calculated with respect to β‐estradiol‐treated control double‐mutant clone 1 (n = 4, mean ± SE).
Real‐time RT–PCR analysis of primary transcripts of GATA‐1/heme‐activated genes in β‐estradiol‐treated WT1 or Bach1‐knockdown double‐mutant clone 1. P‐values were calculated with respect to β‐estradiol‐treated control double‐mutant clone 1 (n = 4, mean ± SE).
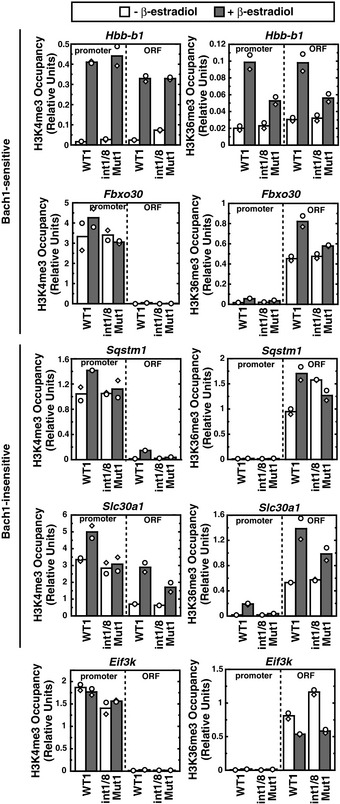
Real‐time RT–PCR analysis of mRNA levels of GATA‐1/heme‐activated genes in untreated or β‐estradiol‐treated WT1 and double‐mutant clones. P‐values were calculated with respect to β‐estradiol‐treated WT1 (n = 4, mean ± SE).
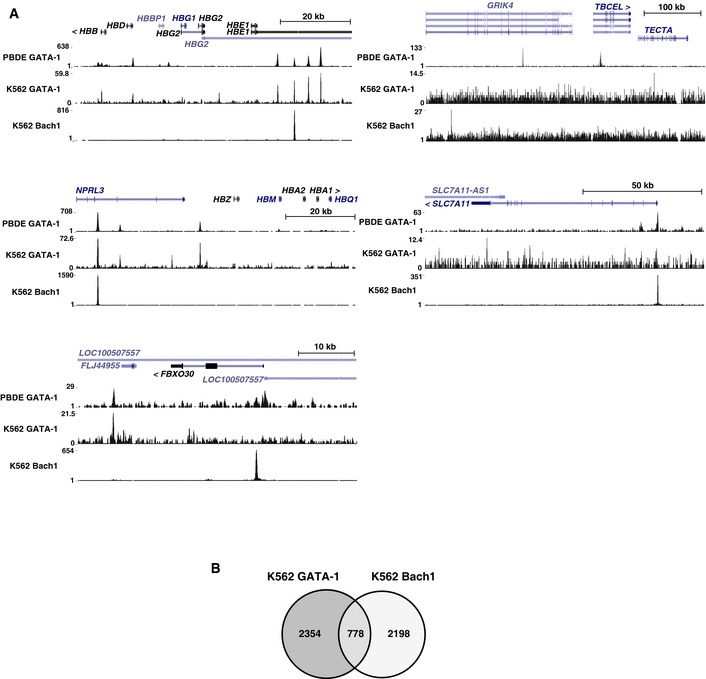
ChIP‐seq data revealed GATA‐1 and Bach1 occupancy at Bach1‐sensitive genes in primary human erythroid cells (peripheral blood‐derived erythroblasts) and K562 erythroleukemia cells (accession numbers: GSM935540, GSM935465, and GSM935576).
Venn diagram depicting relationships between GATA‐1 and Bach1 target genes in K562 cells. The definition of a “target” gene was as follows: the gene had a peak in one of the promoter regions (2 kb upstream of transcription start site (TSS) to 200 bp downstream of TSS), a peak in one of the introns, or a peak in the region 10 kb upstream of TSS, which was not in an intron or promoter of another gene. All target genes were listed in Table EV3.
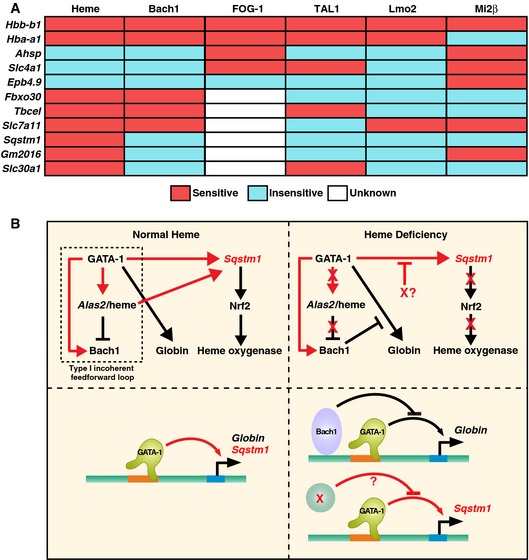
The relationships between heme, Bach1, FOG‐1, TAL1, Lmo2, and Mi2β regulation of GATA‐1 target genes in G1E‐ER‐GATA‐1 cells. “Sensitive” implies significant deregulation upon heme deficiency, FOG‐1‐binding deficiency, or knockdown of the respective factor. TAL1, Lmo2, and Mi2β knockdowns were reported previously 76, 77. Expression of TAL1, Lmo2, and Mi2β decreased by 70%, 75%, and 50%, respectively, by the knockdown. FOG‐1 sensitivity was determined using G1E‐ER‐GATA‐1 (V205G) cells expressing mutated GATA‐1 defective in FOG‐1 binding 82.
Cellular and molecular consequences of heme deficiency on GATA‐1 function. Type I incoherent feed‐forward loop 83 under normal heme conditions that controls heme biosynthesis and globin chain production. This loop also activates a p62‐dependent pathway that can induce Nrf2 and confer cytoprotection 70, and promote autophagy, a process vital for erythroid cell maturation 84, 85, 86, 87. In heme deficiency, Bach1‐sensitive and Bach1‐insensitive (X?) mechanisms disrupt multiple mechanistic steps, thus impairing hemoglobin biosynthesis, cytoprotection, and autophagy. As impaired autophagy and associated molecular defects would compromise cell survival and/or maturation, this underscores the critical implications of the heme mechanism to amplify GATA‐1 activity described herein. The red arrows indicate relationships derived from this study. The black arrows indicate relationships that were either known or predicted from existing knowledge.
References
-
- Gunther V, Lindert U, Schaffner W (2012) The taste of heavy metals: gene regulation by MTF‐1. Biochim Biophys Acta 1823: 1416–1425 - PubMed
-
- Shi Y, Lan F, Matson C, Mulligan P, Whetstine JR, Cole PA, Casero RA, Shi Y (2004) Histone demethylation mediated by the nuclear amine oxidase homolog LSD1. Cell 119: 941–953 - PubMed
-
- Tsukada Y, Fang J, Erdjument‐Bromage H, Warren ME, Borchers CH, Tempst P, Zhang Y (2006) Histone demethylation by a family of JmjC domain‐containing proteins. Nature 439: 811–816 - PubMed
Publication types
MeSH terms
Substances
Grants and funding
LinkOut - more resources
Full Text Sources
Other Literature Sources
Molecular Biology Databases
Research Materials
Miscellaneous
