. 2016 Mar 1:261:29-46.
doi: 10.1016/j.jneumeth.2015.11.029. Epub 2015 Dec 14.

Analysis of simultaneous MEG and intracranial LFP recordings during Deep Brain Stimulation: a protocol and experimental validation

Affiliations

Analysis of simultaneous MEG and intracranial LFP recordings during Deep Brain Stimulation: a protocol and experimental validation

Ashwini Oswal et al. J Neurosci Methods. .

Abstract

Background: Deep Brain Stimulation (DBS) is an effective treatment for several neurological and psychiatric disorders. In order to gain insights into the therapeutic mechanisms of DBS and to advance future therapies a better understanding of the effects of DBS on large-scale brain networks is required.

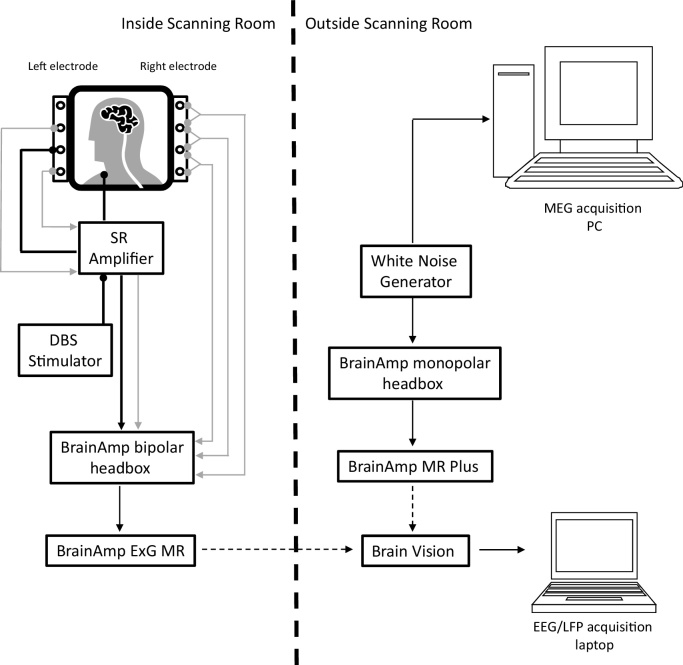
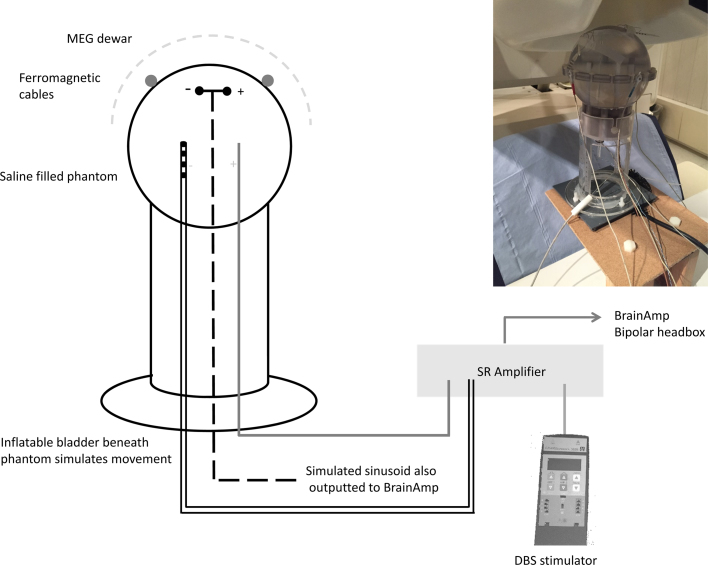
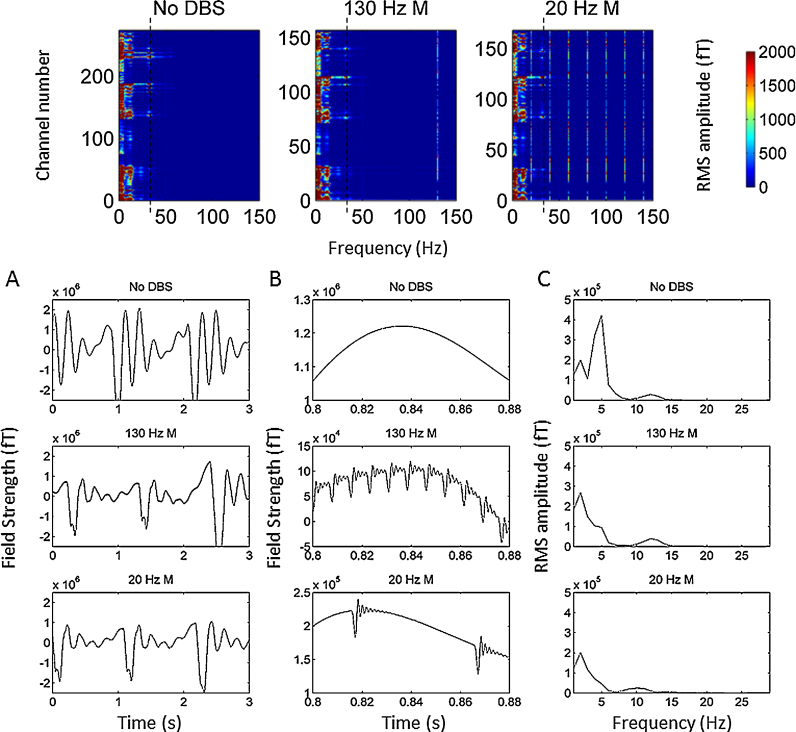
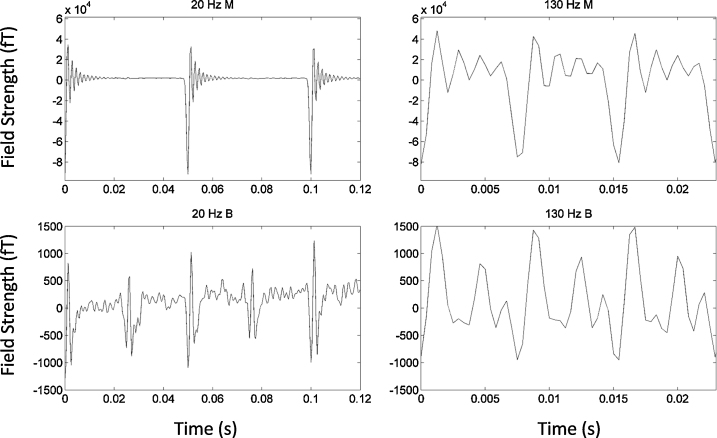
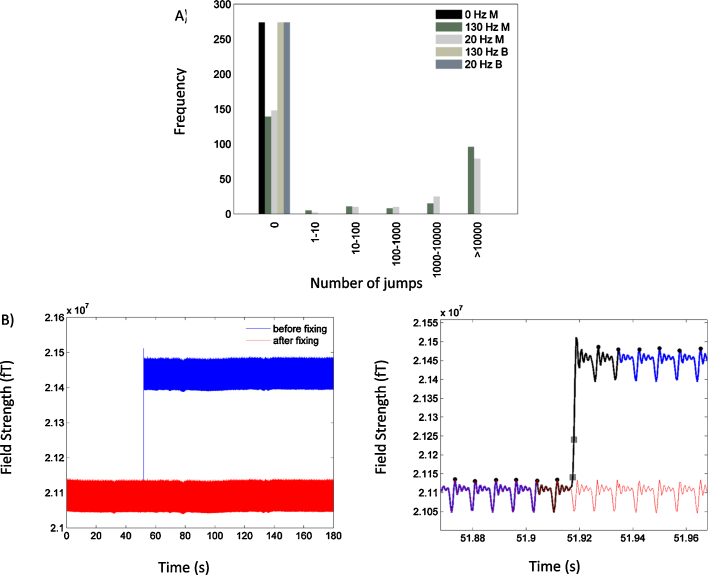
New method: In this paper, we describe an experimental protocol and analysis pipeline for simultaneously performing DBS and intracranial local field potential (LFP) recordings at a target brain region during concurrent magnetoencephalography (MEG) measurement. Firstly we describe a phantom setup that allowed us to precisely characterise the MEG artefacts that occurred during DBS at clinical settings.

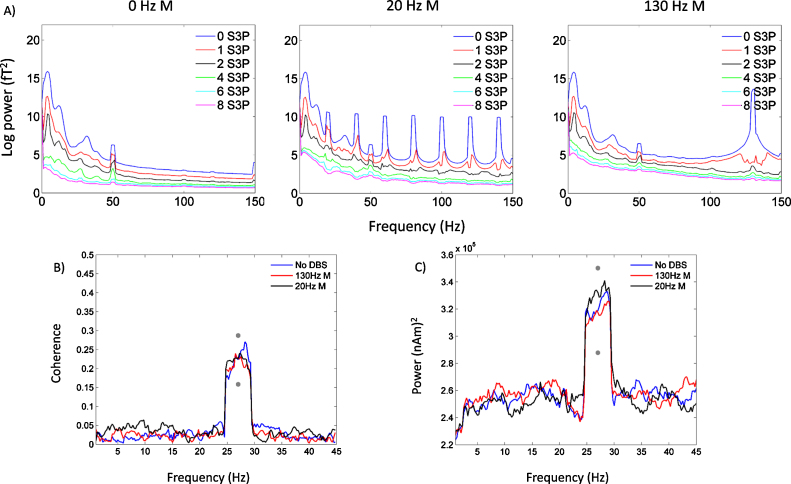
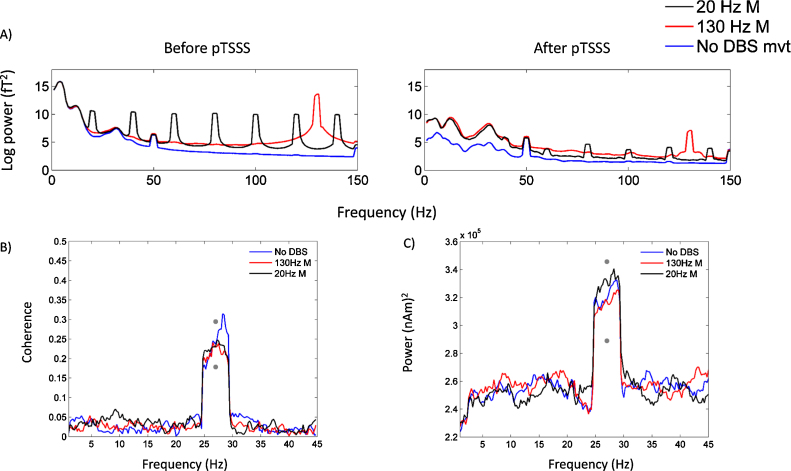
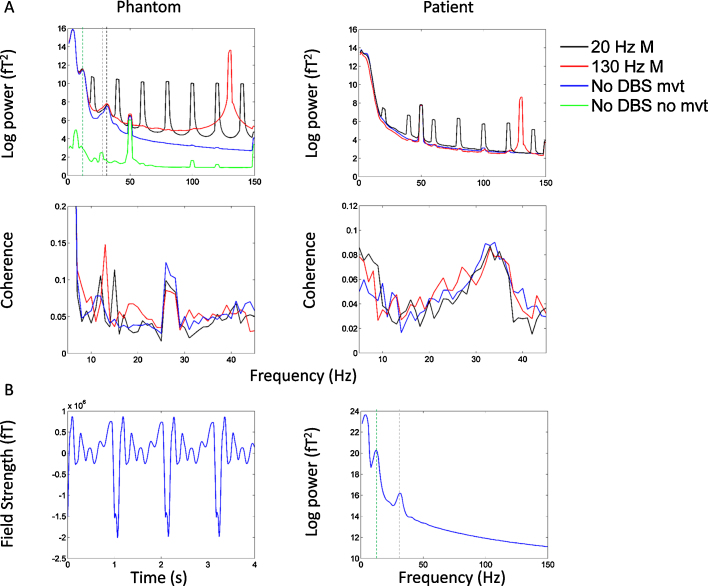
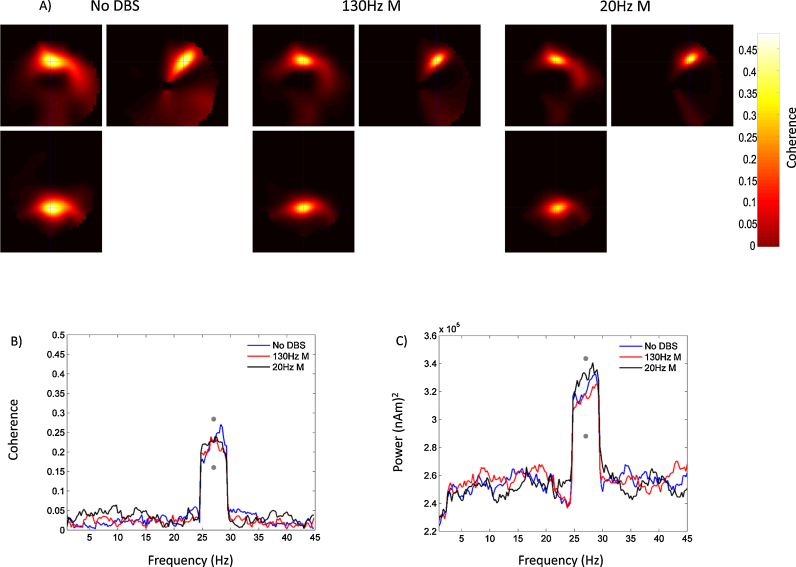
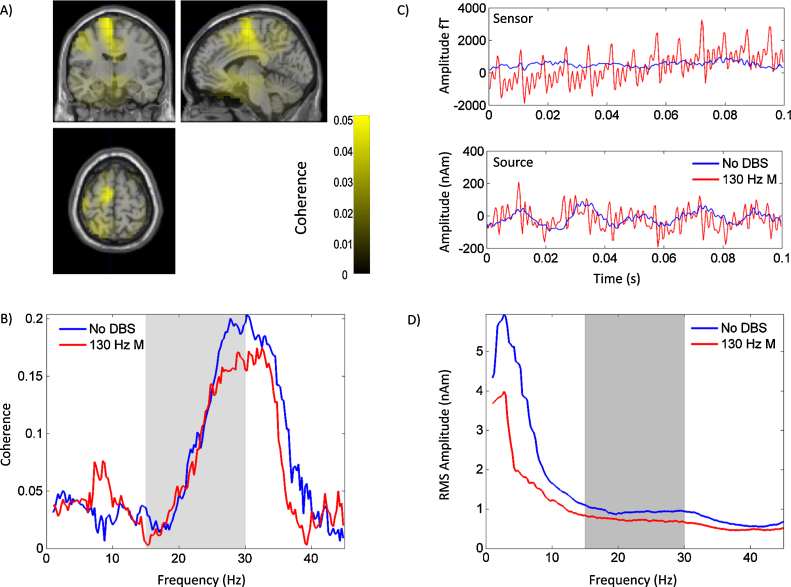
Results: Using the phantom recordings we demonstrate that with MEG beamforming it is possible to recover oscillatory activity synchronised to a reference channel, despite the presence of high amplitude artefacts evoked by DBS. Finally, we highlight the applicability of these methods by illustrating in a single patient with Parkinson's disease (PD), that changes in cortical-subthalamic nucleus coupling can be induced by DBS.

Comparison with existing approaches: To our knowledge this paper provides the first technical description of a recording and analysis pipeline for combining simultaneous cortical recordings using MEG, with intracranial LFP recordings of a target brain nucleus during DBS.

Keywords: Deep Brain Stimulation (DBS); Local Field Potential (LFP); Magnetoencephalography (MEG); Parkinson's disease.


Figures

Fig. 9
Fig. 9
Upper panel (A) shows mean spectra of all MEG channels after removing a fixed number of frequency components using the S3P algorithm. Spectra are shown separately for the no DBS, and two monopolar DBS conditions. Channels with jumps have either been excluded, or corrected using interpolation prior to spectral analysis. Removal of a single spectral component results in good suppression of power at the monopolar DBS frequency (20 Hz or 130 Hz) and its harmonics. Furthermore, this approach can also suppress low frequency artefacts. The lower panel shows the results of performing beamformer analysis following S3P. Note that we decided to adaptively reject components in the two stimulation conditions, such that the power at each frequency could not be less than the power at the corresponding frequency in the no DBS condition. Coherence (B) was computed between the simulated sinusoid with added noise and the beamformer extracted timeseries from the same location as standard beamformer analysis without subspace projection (see Fig. 7). Power spectra (C) were also computed for the source time series. The grey dots represent 95% confidence intervals as per Fig. 7.
Fig. 10
Fig. 10
Upper panel (A) shows mean spectra of all MEG channels before and after denoising with the pTSSS algorithm. Channels with jumps have either been excluded, or corrected using interpolation prior to spectral analysis. The pTSSS algorithm results in suppression of both low frequency artefacts and artefacts occurring at the DBS frequency and its harmonics. The lower panel shows the results of performing beamformer analysis following pTSSS. Coherence (B) was computed between the simulated sinusoid with added noise and the beamformer extracted time-series from the same location as standard beamformer analysis without subspace projection (see Fig. 7). Power spectra (C) were also computed for the source time-series. The grey dots represent 95% confidence intervals as per Fig. 7.
Fig. 1
Fig. 1
Schematic showing our set up for a patient recording within MEG. A bipolar LFP between contacts 0 and 2 of the DBS electrode (see grey lines originating from left electrode) is recorded during concurrent DBS by the stimulation record (SR) amplifier. DBS is given in a monopolar fashion between contact 1 of the DBS electrode and a reference attached to the patient's clavicle (see black lines ending with circles). The SR amplifier outputs the recorded LFP and the stimulation signal (grey arrowed line and black arrowed line) to a bipolar BrainAmp headbox. The latter is also used to record bipolar LFPs from the side not being stimulated (see grey arrowed lines originating from the right electrode). Black dashed arrows depict optic fibre cables, which serve to optically isolate the patient from a mains power source (see methods section). The timings of signals recorded from the MEG and the LFP acquisition laptop are synchronised through the independent recording of a single white noise source on the two systems (see methods for further details).
Fig. 2
Fig. 2
Schematic showing the phantom recording setup within MEG. The phantom was filled with saline and positioned in the MEG Dewar. Three electrodes were immersed in the phantom: (1) An electrode which simulated a dipole with a sinusoidal signal at 27 Hz (shown by the dashed black line), (2) A clinical DBS electrode (see Section 2), one contact of which was used to administer monopolar DBS at clinical settings, and (3) A second electrode for DBS such that monopolar DBS was administered between this electrode and contact 1 of the DBS electrode. In this case, contact 1 of the DBS electrode was the cathode. Note that in this schematic, the dipolar source is shown as being central within the phantom, but its exact location is shown more precisely in Fig. 7. Two ferromagnetic extension cables that are typically used in patient recordings were taped loosely to the surface of the phantom. Heartbeat artefacts (see Section 2) were simulated using an inflatable bladder that was positioned beneath the phantom and periodically inflated at a rate of 1 Hz. For the phantom recordings the stimulation-record amplifier (SR amplifier) was used in conjunction with the external stimulator to provide DBS. In patient recordings however, the SR amplifier was also used to record the STN LFP during DBS and to amplify this before outputting it to the BrainAmp device. A copy of the simulated sinusoidal signal was also outputted to BrainAmp.
Fig. 3
Fig. 3
Upper panel displays individual channel spectra for the no DBS condition and the 130 Hz and 20 Hz monopolar DBS conditions. The colour bar represents RMS amplitude in femtoTesla (fT). Low frequency high amplitude artefacts (<10 Hz) affect the majority of channels. Note that the spectra for the two stimulation conditions contain fewer channels, since channels with large numbers of jumps have been rejected. The dotted black line displays a separate type of artefact at 32 Hz, which is further described in Fig. 5. In order to establish the temporal characteristics of the low frequency artefacts, single channel data are presented for a 3 s long recording period with the highest power at frequencies less than 10 Hz. Data are presented in the lower panel of Fig. 3 for the no DBS condition and the two monopolar DBS conditions. The left hand side plots (Panel A) show 3 s of data with the same y axis for comparison of the signal amplitudes. The middle plots (Panel B) show only 0.08 s of data and the y axis are varied so that the signal can be better visualised in all 3 conditions. The plots on the far right (Panel C) are the spectra of the data presented in Panel A. The effects of movements of the ferromagnetic wires which occur at a rate of approximately 1 Hz are clearly visualised in Panel A.
Fig. 4
Fig. 4
The ringing artefacts are shown for a single MEG channel following three stimulation pulses for the 20 Hz and 130 Hz monopolar and bipolar stimulation conditions. The artefacts induced by bipolar DBS are approximately 25 times lower in amplitude than those induced by monopolar DBS. Furthermore, the period between stimulation pulses is longer and therefore less influenced by ringing during 20 Hz DBS than during 130 Hz DBS (50 ms during 20 Hz and 7.7 ms during 130 Hz).
Fig. 5
Fig. 5
In the top left panel, mean spectra of all MEG channels are shown for the No DBS, 130 Hz monopolar DBS and 20 Hz monopolar DBS conditions in the phantom experiment. For reference, the green line shows mean spectra when the ferromagnetic wires and the heart beat artefact, caused by periodic movement were not present. Channels with jumps have either been excluded, or corrected using interpolation prior to spectral analysis. In the No DBS, 130 Hz monopolar DBS and 20 Hz monopolar DBS conditions there are large spectral peaks at approximately 12 Hz (green dotted line) and at 32 Hz (black dotted line). These spectral artefacts were not observed in corresponding plots from the patient analysis (top right panel), and are related to the damped movement of ferromagnetic wires. Panel 5B shows a single channel with prominent artefacts at 12 Hz and 32 Hz and its corresponding spectra. Note that a spectral peak at 27 Hz, the frequency of the simulated sinusoid, is seen when ferromagnetic wires and heart beat artefacts are not present (dotted grey line) (For interpretation of the references to colour in this figure legend, the reader is referred to the web version of this article.). The small peak at 50 Hz represents power line noise. Monopolar DBS results in a large artefact peak at the stimulation frequency (20 Hz or 130 Hz) and its harmonics. Similar spectra are shown for the bipolar DBS conditions in Supplementary Fig. S1. The middle left and right panels of Fig. 5 display mean coherence between the reference channel and all MEG channels in the phantom and patient experiments for all experimental conditions. In the phantom experiment, where the reference channel is the simulated sinusoidal signal with added noise, there is a clear peak in coherence at the frequency of the simulated sinusoid (27 Hz), which is similar in magnitude for all experimental conditions. In the patient experiment, coherence between the STN LFP and all MEG sensors is maximal at approximately 32 Hz. Furthermore, the magnitude of coherence is similar for all conditions studied.
Fig. 6
Fig. 6
(A) The frequency of the number of jumps in each channel is plotted for the different experimental conditions in the phantom experiment. The stimulation conditions are labelled in the legend by the frequency of stimulation in Hz and either M or B which represent monopolar or bipolar stimulation respectively. Large amplitude jumps were not present during bipolar DBS at 130 Hz or 20 Hz or when DBS was off (see black bar), but appeared during monopolar stimulation at both 20 Hz and 130 Hz. B: The plot on the left hand side shows the signal recorded by a single MEG channel before (blue) and after (red) fixing of a segment containing a single jump, using the interpolation technique described in Section 2. The plot on the right hand side shows a segment of data surrounding the jump. The blue and red lines display the data before and after fixing of the jump. The black line represents the data segment that is interpolated and the grey squares show samples either side of the first jump within the region encompassed by the black line. Interpolation involved averaging data segments between stimulation pulse peaks (shown by the black circles) as described in Section 2. (For interpretation of the references to colour in this figure legend, the reader is referred to the web version of this article.).
Fig. 7
Fig. 7
Panel A shows DICS beamformer images of coherence between the simulated LFP and a 5 mm spaced grid within the phantom. These images were interpolated, as described in Section 2, giving final images with 2 mm resolution. Coherence images are shown for the three different experimental conditions: no DBS, monopolar DBS at 130 Hz and monopolar DBS at 20 Hz. In all cases the coherent source was clearly visualised, and the coherence values (see colour bar) were comparable between the three different stimulation conditions. The intersection of the cross-hairs indicates the location of the peak value of coherence, which was identical across experimental conditions. Panel B shows coherence between the simulated LFP and LCMV beamformer extracted source time series from the location of peak coherence indicated by the cross-hairs in Panel A. Coherence is plotted as a function of frequency for the three experimental conditions. The grey dots indicate 95% confidence intervals of the null distribution of condition specific coherence differences at 27 Hz generated by permutation testing. For sake of visualisation, this confidence interval has been added to the absolute value of coherence at 27 Hz for the no DBS condition. All of the observed differences in coherence between stimulation conditions lie within this limit, highlighting the absence of statistically significant differences. Panel C shows a power spectrum of the extracted source time series with the grey dots representing 95% confidence intervals of the null distribution of condition specific power differences at 27 Hz which have been added to the absolute value of power at 27 Hz for the no DBS condition.
Fig. 8
Fig. 8
The results of the patient analysis are shown. Panel A shows a DICS beamformer image of coherence in the beta frequency (15–30 Hz) range between the left STN 0-2 bipole and the whole brain when the patient is at rest without DBS. The unthresholded DICS coherence image is superimposed onto a T1 weighted canonical MRI. Coronal, sagittal and axial sections through the image are displayed. The intersection of the cross-hairs represents the location of peak coherence (MNI co-ordinates -6 -10 66 corresponding to the premotor/supplementary motor areas). Source time series are extracted from the peak location and source RMS amplitudes and STN-cortical source coherence are computed for the no DBS and the 130 Hz DBS conditions. The results are shown in Fig. 8D and B respectively. The grey region indicates the beta frequency range which was used to determine the location of the cortical source. Finally panel C shows a 0.1 s long segment of data recorded from a single MEG channel and from the source time series in the no DBS and the 130 Hz monopolar DBS conditions. It is evident that the sensor level artefacts that are observed during DBS are quite well suppressed by beamforming.

Similar articles

Cited by

References

    1. Airaksinen K., Mäkelä J.P., Taulu S., Ahonen A., Nurminen J., Schnitzler A. Effects of DBS on auditory and somatosensory processing in Parkinson's disease. Hum Brain Mapp. 2011;32(7):1091–1099. - PMC - PubMed
    1. Airaksinen K., Butorina A., Pekkonen E., Nurminen J., Taulu S., Ahonen A. Somatomotor mu rhythm amplitude correlates with rigidity during deep brain stimulation in Parkinsonian patients. Clin Neurophysiol. 2012;123(10):2010–2017. - PubMed
    1. Airaksinen K., Mäkelä J.P., Nurminen J., Luoma J., Taulu S., Ahonen A. Cortico-muscular coherence in advanced Parkinson's disease with deep brain stimulation. Clin Neurophysiol. 2014:S1388–S2457. - PubMed
    1. Brookes M.J., Vrba J., Robinson S.E., Stevenson C.M., Peters A.M., Barnes G.R. Optimising experimental design for MEG beamformer imaging. Neuroimage. 2008;39(4):1788–1802. - PubMed
    1. Cao C., Li D., Jiang T., Ince N.F., Zhan S., Zhang J. Resting state cortical oscillations of PD patients without and with subthalamic deep brain stimulation, a MEG study. J Clin Neurophysiol. 2015;32(2):109–118. - PubMed

Publication types