. 2015 Dec 23:16:412.
doi: 10.1186/s12859-015-0842-3.

Unsupervised image segmentation for microarray spots with irregular contours and inner holes

Affiliations

Unsupervised image segmentation for microarray spots with irregular contours and inner holes

Bogdan Belean et al. BMC Bioinformatics. .

Abstract

Background: Microarray analysis represents a powerful way to test scientific hypotheses on the functionality of cells. The measurements consider the whole genome, and the large number of generated data requires sophisticated analysis. To date, no gold-standard for the analysis of microarray images has been established. Due to the lack of a standard approach there is a strong need to identify new processing algorithms.

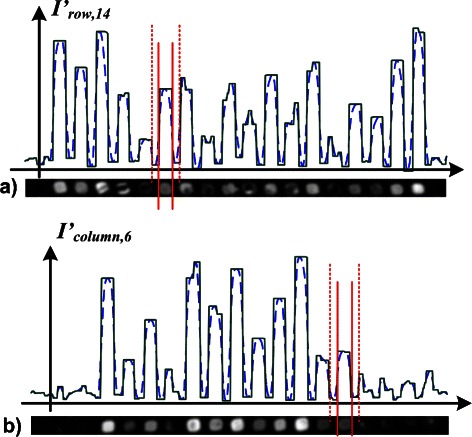
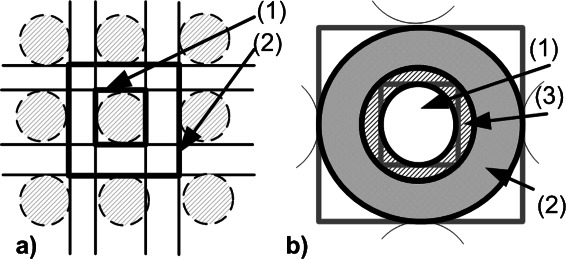
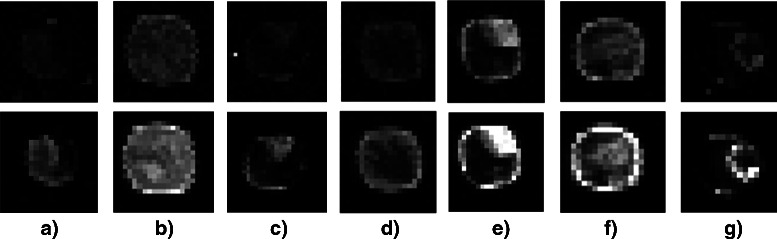
Methods: We propose a novel approach based on hyperbolic partial differential equations (PDEs) for unsupervised spot segmentation. Prior to segmentation, morphological operations were applied for the identification of co-localized groups of spots. A grid alignment was performed to determine the borderlines between rows and columns of spots. PDEs were applied to detect the inflection points within each column and row; vertical and horizontal luminance profiles were evolved respectively. The inflection points of the profiles determined borderlines that confined a spot within adapted rectangular areas. A subsequent k-means clustering determined the pixels of each individual spot and its local background.

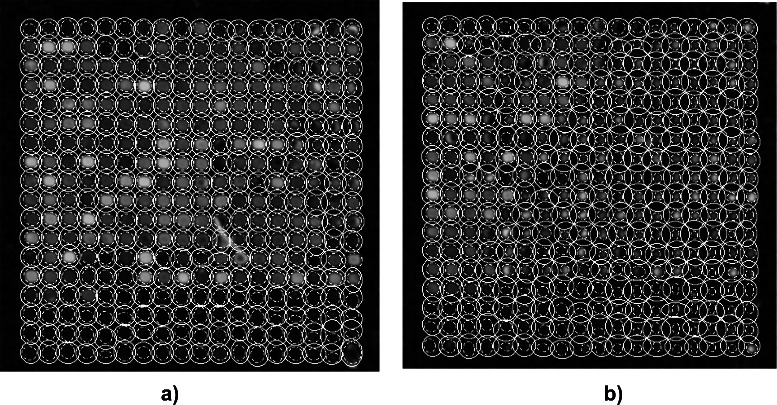
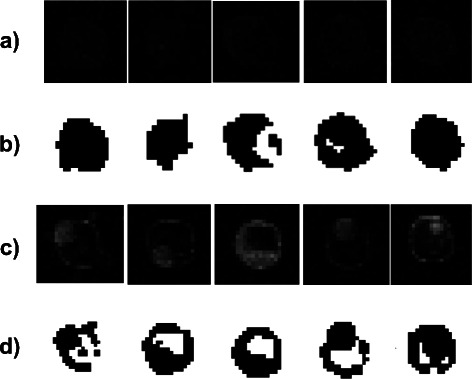
Results: We evaluated the approach for a data set of microarray images taken from the Stanford Microarray Database (SMD). The data set is based on two studies on global gene expression profiles of Arabidopsis Thaliana. We computed values for spot intensity, regression ratio, and coefficient of determination. For spots with irregular contours and inner holes, we found intensity values that were significantly different from those determined by the GenePix Pro microarray analysis software. We determined the set of differentially expressed genes from our intensities and identified more activated genes than were predicted by the GenePix software.

Conclusions: Our method represents a worthwhile alternative and complement to standard approaches used in industry and academy. We highlight the importance of our spot segmentation approach, which identified supplementary important genes, to better explains the molecular mechanisms that are activated in a defense responses to virus and pathogen infection.


Figures

Fig. 1
Fig. 1
a The microarray image was taken from SMD database (ID 20385). The image shows the intensity of fluorescent light emitted from dye cyanine Cy3. The spots of high intensity indicate sequence-specific hybridisation of labelled DNA extracted from Arabidopsis thaliana. The experiment has been designed to study global transcriptional factors of hormone treatment. The detection of groups of co-localized spots is shown by the grid of the global addressing. The groups of spots are separated by the horizontal and vertical lines of the grid. b A sub-image of the microarray image shown in a). The sub-image depicts a group of 324 co-localized spots. The size of a sub-image is in round numbers 460×480 pixels. Spots of high intensity are separated by lines of a grid. Inflection points of intensity profiles were computed to align the grid, see Section Grid alignment. The horizontal and vertical lines of the griding separate rows and columns of spots. The two horizontal broken lines and the two vertical broken lines cut out a slice of the 14th row and of the 6th column of spots, respectively. c The procedure of grid alignment yields a stable separation even for spots with non-spherical profiles, low intensities or high background signal
Fig. 2
Fig. 2
a The image of the 14th row of spots from Fig. 1 b is depicted at the bottom. The intensity profile before (broken line) and after (solid line) shock filter iteration is represented on top of the image. Vertical lines are drawn in red at positions of inflection points. The solid lines indicate border lines for the spot in row 14 and column 6. The broken lines confine its local background area. b The image of the 6th column of spots from Fig. 1 b is shown at the bottom (rotated counter clockwise by 90°). The intensity profile before (broken line) and after (solid line) shock filter iteration is depicted on top of the image. Vertical lines are drawn in red at positions of inflection points. The solid lines indicate border lines for the spot in row 14 and column 6. The broken lines confine its local background area
Fig. 3
Fig. 3
a The schematic diagram shows rectangles, R small (1) and R big (2). R small embeds only the spot in the middle of the field, whereas R big encloses additionally the local background area. b A blow up of the two rectangles, R small and R big, lead to the definition of the three inscribed ellipses E F, E B, and E E. The defined ellipses show the areas of foreground (1), background (2), and exclusion zone (3) pixels
Fig. 4
Fig. 4
The geometrical features of each spot are approximated by a foreground ellipse E F (broken line) and a background ellipse E B (solid line). The approximation is shown for two groups of spots, i.e., two sub-images of image AT20391 (dye Cy3) depicted in figure panels a and b respectively. Spots of low intensity and non-spherical profiles, as well as artifacts of high background signal, make the identification and description of foreground and background area non-trivial. The ellipses show a rather high diversity in size and form but give a reasonable initial approximation of the foreground and background area of each spot
Fig. 5
Fig. 5
a The blow ups exemplify spots with low intensity. b The black areas are the computed foregrounds of the spots above. c The blow ups exemplify spots with irregular contours and inner holes. d The black areas are the computed foregrounds of the spots above
Fig. 6
Fig. 6
The red channel (first column) and green channel (second column) of two spots exemplify two categories of spots: a A perfect spot with preferable spherical and homogeneous intensity distribution. b An irregular spot with high contrast between foreground and background intensity. The spots with spot no. a) 100, and b) 3260 are from microarray ID 20385
Fig. 7
Fig. 7
Selection of up-regulated spots that have not been identified by the standard approach of GenePix: spot no. a 2321, b 13,150, c 6294, d 4648 on microarray ID 20385, spot no. e 1317 and f 6728 on microarray ID 20391 and spot no. g 4422 on microarray ID 20392. Our approach allows for the irregular contours and the non-homogeneous intensity distributions of these spots. Standard approximations of the bright foreground areas based on the simple geometric forms of ellipses are problematic

Similar articles

Cited by

References

    1. Schena M. Microarray Analysis. New York: Wiley; 2003.
    1. Ioannidis JP. Microarrays and molecular research: noise discovery. Lancet. 2005;365:454–5. doi: 10.1016/S0140-6736(05)70249-X. - DOI - PubMed
    1. Ioannidis JPA, Allison DB, Ball CA, Coulibaly I, Cui X, Culhane AC, et al. Repeatability of published microarray gene expression analyses. Nat Genet. 2008;41:149–55. doi: 10.1038/ng.295. - DOI - PubMed
    1. Campbell JP, Hatfield WT, Heyer LJ. Make microarray data with known ratios. CBE. Life Sci Educ. 2007;6:196–7. doi: 10.1187/cbe.07-05-0028. - DOI - PMC - PubMed
    1. Srinivasan L, Rakvongthai Y, Oraintara S. Microarray Image Denoising using Complex Gaussian Scale Mixtures of Complex Wavelets. IEEE J Biomed Health Inform. 2014;18(4):1423–30. doi: 10.1109/JBHI.2014.2318279. - DOI - PubMed

Publication types

MeSH terms

LinkOut - more resources