

Across population genomic prediction scenarios in which Bayesian variable selection outperforms GBLUP
- PMID: 26698836
- PMCID: PMC4690391
- DOI: 10.1186/s12863-015-0305-x
Across population genomic prediction scenarios in which Bayesian variable selection outperforms GBLUP
Abstract
Background: The use of information across populations is an attractive approach to increase the accuracy of genomic prediction for numerically small populations. However, accuracies of across population genomic prediction, in which reference and selection individuals are from different populations, are currently disappointing. It has been shown for within population genomic prediction that Bayesian variable selection models outperform GBLUP models when the number of QTL underlying the trait is low. Therefore, our objective was to identify across population genomic prediction scenarios in which Bayesian variable selection models outperform GBLUP in terms of prediction accuracy. In this study, high density genotype information of 1033 Holstein Friesian, 105 Groningen White Headed, and 147 Meuse-Rhine-Yssel cows were used. Phenotypes were simulated using two changing variables: (1) the number of QTL underlying the trait (3000, 300, 30, 3), and (2) the correlation between allele substitution effects of QTL across populations, i.e. the genetic correlation of the simulated trait between the populations (1.0, 0.8, 0.4).
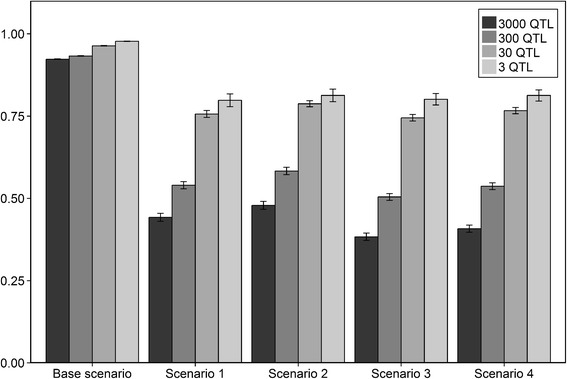
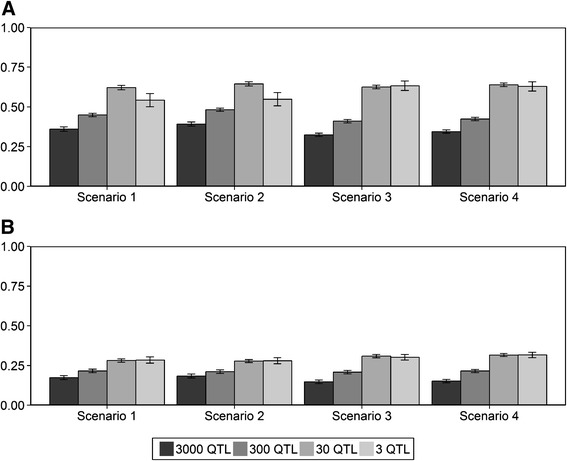
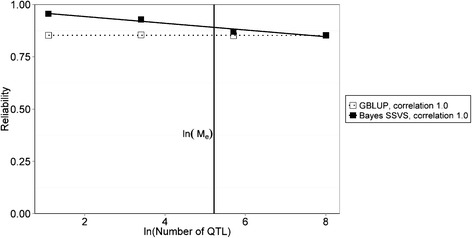
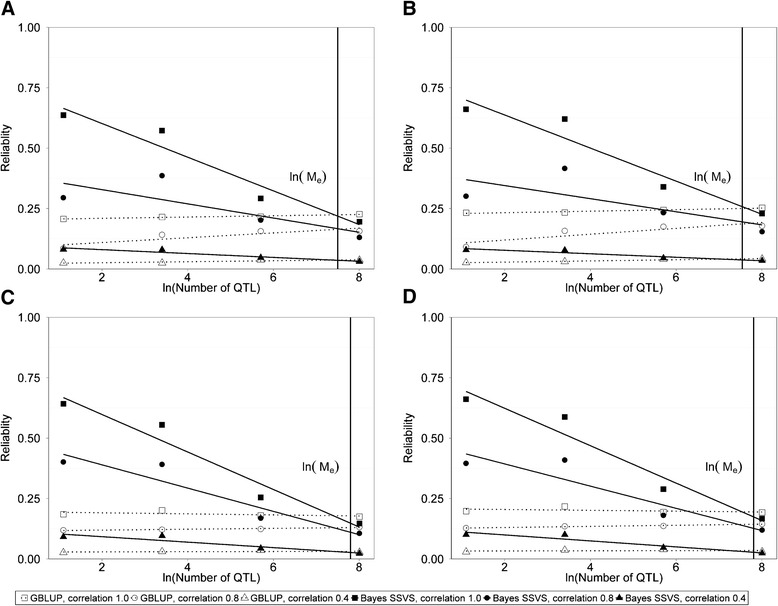
Results: The accuracy obtained by the Bayesian variable selection model was depending on the number of QTL underlying the trait, with a higher accuracy when the number of QTL was lower. This trend was more pronounced for across population genomic prediction than for within population genomic prediction. It was shown that Bayesian variable selection models have an advantage over GBLUP when the number of QTL underlying the simulated trait was small. This advantage disappeared when the number of QTL underlying the simulated trait was large. The point where the accuracy of Bayesian variable selection and GBLUP became similar was approximately the point where the number of QTL was equal to the number of independent chromosome segments (M e ) across the populations.
Conclusion: Bayesian variable selection models outperform GBLUP when the number of QTL underlying the trait is smaller than M e . Across populations, M e is considerably larger than within populations. So, it is more likely to find a number of QTL underlying a trait smaller than M e across populations than within population. Therefore Bayesian variable selection models can help to improve the accuracy of across population genomic prediction.
Figures
Similar articles
-
Empirical and deterministic accuracies of across-population genomic prediction.Genet Sel Evol. 2015 Feb 6;47(1):5. doi: 10.1186/s12711-014-0086-0. Genet Sel Evol. 2015. PMID: 25885467 Free PMC article.
-
Impact of QTL properties on the accuracy of multi-breed genomic prediction.Genet Sel Evol. 2015 May 8;47(1):42. doi: 10.1186/s12711-015-0124-6. Genet Sel Evol. 2015. PMID: 25951906 Free PMC article.
-
Using selection index theory to estimate consistency of multi-locus linkage disequilibrium across populations.BMC Genet. 2015 Jul 19;16:87. doi: 10.1186/s12863-015-0252-6. BMC Genet. 2015. PMID: 26187501 Free PMC article.
-
Invited review: Genomic selection in dairy cattle: progress and challenges.J Dairy Sci. 2009 Feb;92(2):433-43. doi: 10.3168/jds.2008-1646. J Dairy Sci. 2009. PMID: 19164653 Review.
-
Review: How to improve genomic predictions in small dairy cattle populations.Animal. 2016 Jun;10(6):1042-9. doi: 10.1017/S1751731115003031. Epub 2016 Jan 19. Animal. 2016. PMID: 26781646 Review.
Cited by
-
Evaluation of genomic selection models using whole genome sequence data and functional annotation in Belgian Blue cattle.Genet Sel Evol. 2025 Mar 4;57(1):10. doi: 10.1186/s12711-025-00955-5. Genet Sel Evol. 2025. PMID: 40038647 Free PMC article.
-
Genetic Basis for Resistance Against Viral Nervous Necrosis: GWAS and Potential of Genomic Prediction Explored in Farmed European Sea Bass (Dicentrarchus labrax).Front Genet. 2022 Mar 25;13:804584. doi: 10.3389/fgene.2022.804584. eCollection 2022. Front Genet. 2022. PMID: 35401661 Free PMC article.
-
Strategies to improve genomic predictions for 35 duck carcass traits in an F2 population.J Anim Sci Biotechnol. 2023 May 6;14(1):74. doi: 10.1186/s40104-023-00875-8. J Anim Sci Biotechnol. 2023. PMID: 37147656 Free PMC article.
-
Stacked kinship CNN vs. GBLUP for genomic predictions of additive and complex continuous phenotypes.Sci Rep. 2022 Nov 18;12(1):19889. doi: 10.1038/s41598-022-24405-0. Sci Rep. 2022. PMID: 36400808 Free PMC article.
-
Genomic evaluation of feed efficiency component traits in Duroc pigs using 80K, 650K and whole-genome sequence variants.Genet Sel Evol. 2018 Apr 6;50(1):14. doi: 10.1186/s12711-018-0387-9. Genet Sel Evol. 2018. PMID: 29625549 Free PMC article.
References
Publication types
MeSH terms
LinkOut - more resources
Full Text Sources
Other Literature Sources
