. 2016 Jan 12;23(1):128-42.
doi: 10.1016/j.cmet.2015.10.013. Epub 2015 Nov 19.

Mitochondrial SIRT3 Mediates Adaptive Responses of Neurons to Exercise and Metabolic and Excitatory Challenges

Affiliations

Mitochondrial SIRT3 Mediates Adaptive Responses of Neurons to Exercise and Metabolic and Excitatory Challenges

Aiwu Cheng et al. Cell Metab. .

Abstract

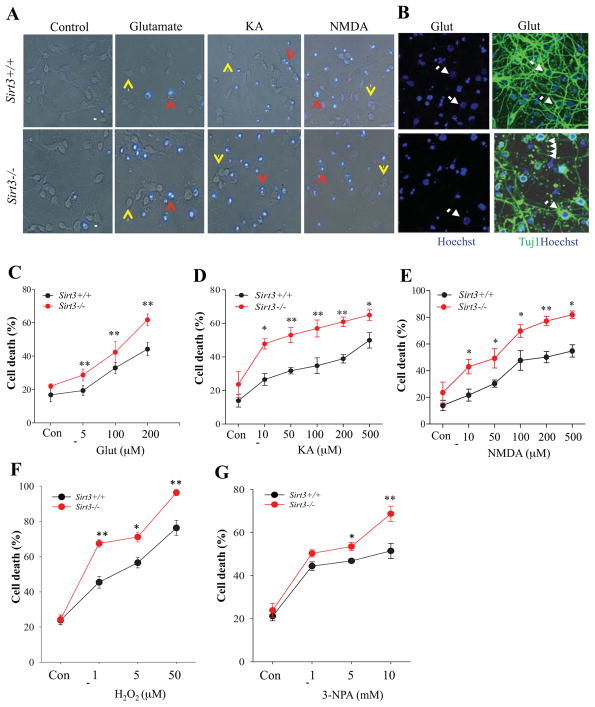
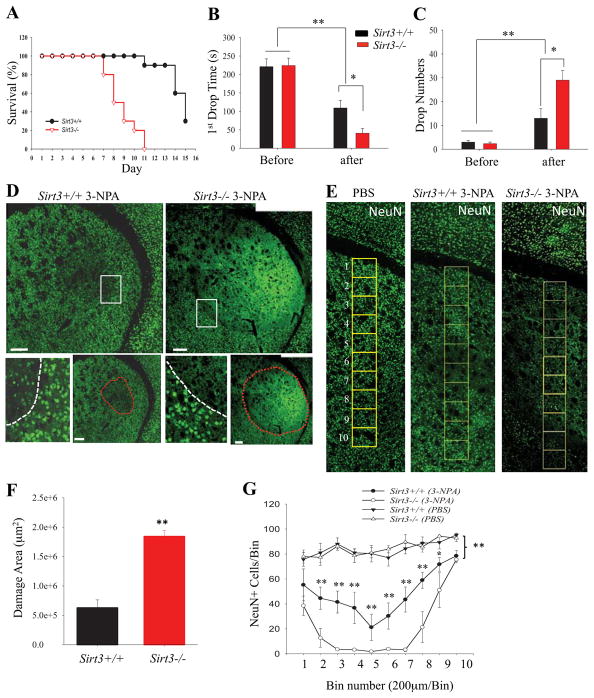
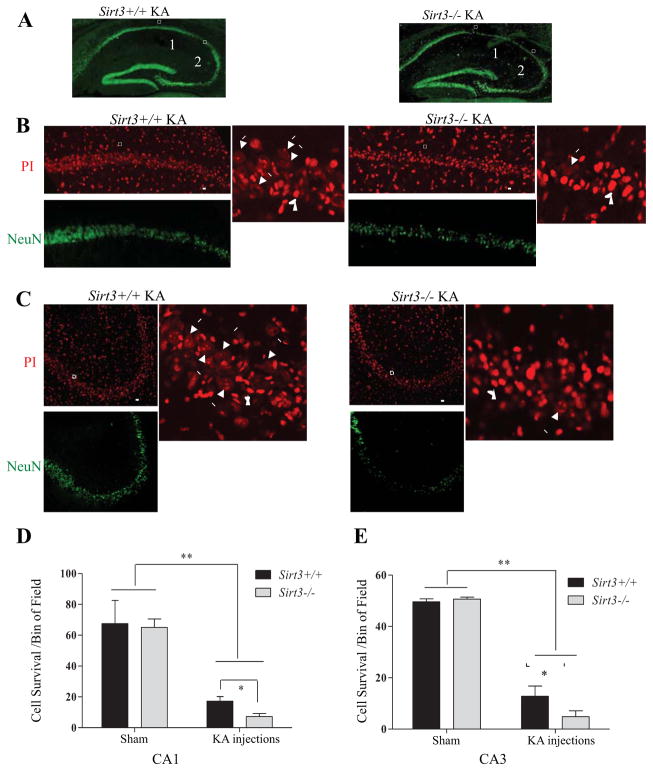
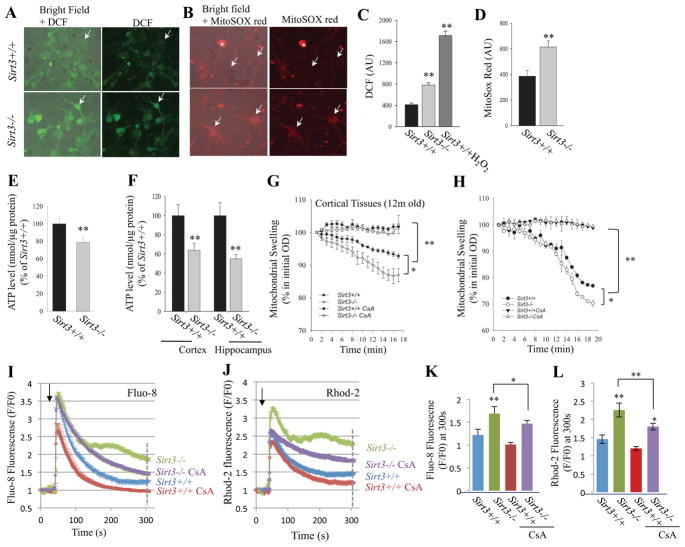
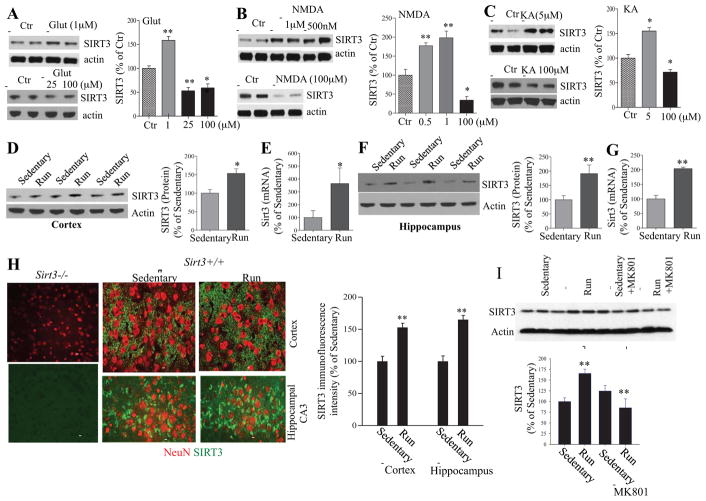
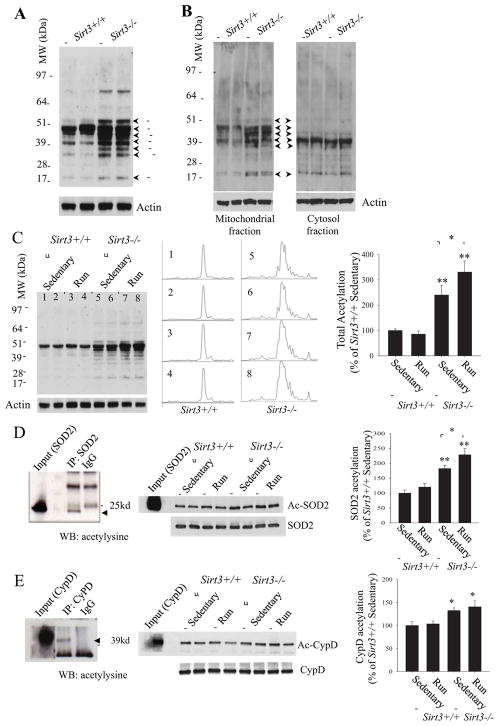
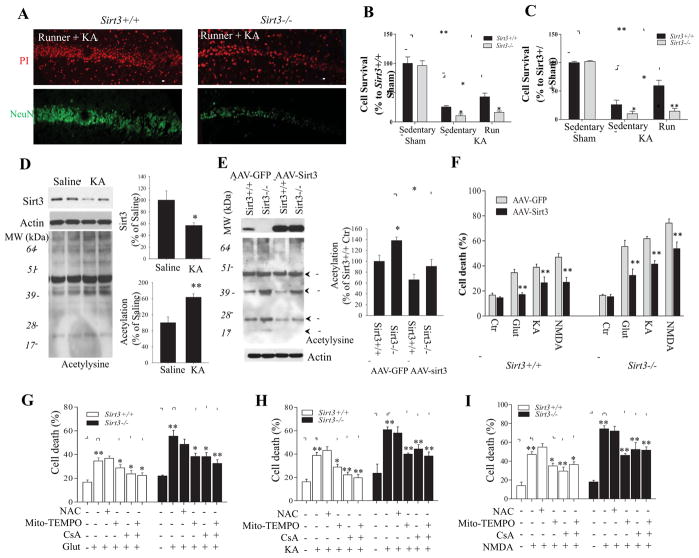
The impact of mitochondrial protein acetylation status on neuronal function and vulnerability to neurological disorders is unknown. Here we show that the mitochondrial protein deacetylase SIRT3 mediates adaptive responses of neurons to bioenergetic, oxidative, and excitatory stress. Cortical neurons lacking SIRT3 exhibit heightened sensitivity to glutamate-induced calcium overload and excitotoxicity and oxidative and mitochondrial stress; AAV-mediated Sirt3 gene delivery restores neuronal stress resistance. In models relevant to Huntington's disease and epilepsy, Sirt3(-/-) mice exhibit increased vulnerability of striatal and hippocampal neurons, respectively. SIRT3 deficiency results in hyperacetylation of several mitochondrial proteins, including superoxide dismutase 2 and cyclophilin D. Running wheel exercise increases the expression of Sirt3 in hippocampal neurons, which is mediated by excitatory glutamatergic neurotransmission and is essential for mitochondrial protein acetylation homeostasis and the neuroprotective effects of running. Our findings suggest that SIRT3 plays pivotal roles in adaptive responses of neurons to physiological challenges and resistance to degeneration.

Keywords: CypD; ROS; SOD2; excitotoxicity; mPTP; mitochondria; neurodegeneration; voluntary exercise.


Figures

Figure 1
Figure 1. Neurons lacking SIRT3 exhibit increased vulnerability to excitotoxic, oxidative and metabolic stress
(A) Representative merged phase-contrast and Hoechst dye fluorescence (blue) images of cultured cortical neurons from Sirt3+/+ and Sirt3−/− mice that had been exposed for 24 hours to the indicated agents. Viable neurons (indicated by yellow arrows) exhibit weak diffuse nuclear DNA-associated (Hoechst) fluorescence and intact neurites, whereas dying/dead neurons (indicated by red arrows) exhibit intense punctate Hoechst fluorescence as a result of nuclear chromatin condensation, and fragmented neurites. Treatment concentrations: 200 μM glutamate, 200 μM kainic acid (KA), 200 μM N-methyl-D-aspartate (NMDA). Scale bar = 20 μm. (B) Representative images of Hoechst staining (blue), and merged Tuj1 fluorescent immunostaining (green) and Hoechst staining of cultured neurons from Sirt3+/+ and Sirt3−/− mice that had been exposed to 200 μM glutamate for 24 h. Arrows indicate surviving Tuj1+ neurons and arrowheads indicate neurite fragmentation. (C–G) Results of quantitative analysis of neuronal death. Values are mean ± SEM of cell counts performed on cultures established from 4 or 5 mice. *p<0.05, **P<0.01.
Figure 2
Figure 2. Striatal neurons of mice lacking SIRT3 exhibit hypersensitivity to degeneration in the 3-nitropropionic acid (3-NPA) model of Huntington’s disease
(A) Modified Kaplan-Meier survival curves for Sirt3+/+ and Sirt3−/− mice. Mice (10 of each genotype) were given 3-NPA (30 mg/kg) once daily and mortality was quantified as described in Materials and Methods. (B and C) Results of rotarod testing. Before the initial 3-NPA injection, and after the 7th daily 3-NPA injection (30 mg/kg/day) motor performance was evaluated by measuring the latency to the first fall from the rotarod (B) and the total number of falls during a 300 second period (C). Values are mean ± SEM. (8–10 mice per group). (D and E) Confocal images showing a cerebral hemisphere in a coronal brain section immunostained with NeuN (green) to label neuronal nuclei (after 7 days of 3-NPA injection). The lower images show the border (white dotted line) between the area of neuronal damage and the relatively undamaged area. In Sirt3+/+ mice there were many NeuN+ cells in the area of cell loss compared to Sirt3−/− mice which exhibited nearly complete neuronal loss. The area demarcated by the red dotted line indicates the damaged area in the same images of Sirt3+/+ and Sirt3−/− mice, respectively as shown in the corresponding upper panel. Bars = 200 μm. Panel F shows higher magnification confocal images of brain sections stained with NeuN with a vertical column of 200 x 200 μm bins overlayed on the striatum. (F) Graph showing values for area of striatal cell loss determined from analysis of brain sections from Sirt3+/+ and Sirt3−/− mice (after 7 days of 3-NPA injection). Values are mean ± SEM (n = 5–6 mice per group). **P<0.01. (G) The number of neurons (NeuN+ cells) were counted in bins of a vertical strip of each tissue section as showed in (F) that spanned the dorsal-ventral axis of the striatum. Control Sirt3+/+ and Sirt3−/− mice were injected with PBS. Values are mean ± SEM. (n = 5–6 mice per group). *P<0.05, **P<0.01 compared to Sirt3+/+ mice treated with 3-NPA.
Figure 3
Figure 3. Hippocampal neurons of SIRT3-deficient mice exhibit hypersensitivity to seizure-induced degeneration
(A) Low magnification images showing NeuN immunostaining in coronal sections of hippocampus of Sirt3+/+ and Sirt3−/− mice that had been administered kainic acid (KA) 7 days prior to euthanasia. Boxes 1 and 2 enclose pyramidal neurons in regions CA1 and CA3, respectively. (B and C) Higher magnification confocal images showing NeuN immunostaining (green) and propidium iodide staining (PI, red) in the CA1 (B) and CA3 (C) regions of the hippocampus of mice that had been administered KA 7 days previously. Arrows in the right panels point alive cells with evenly distributed and dimmer PI staining in contrast to the surrounding dead cells with condensed and bright PI staining of nuclei (arrow head). (D and E) Results of quantitative analysis of the number of undamaged neurons in bin areas (200 μm x 50 μm) of CA1 and CA3. Values are mean ± SEM (n= 5 mice per group; analysis was performed on 2 sections anterior to and 2 sections posterior to the needle track. *p < 0.05 and **p <0.01.
Figure 4
Figure 4. Evidence that SIRT3 suppresses mitochondrial oxidative stress, sustains ATP levels, inhibits mitochondrial membrane permeability transition and improves cellular Ca2+ handling in neurons
(A and B). Representative images of DCF fluorescence (A) and MitoSox Red fluorescence (B) in primary Sirt3+/+ and Sirt3−/− cortical neurons (8 days in culture). The left panels are merged phase-contrast and fluorescence images to enable visualization of neurons that exhibit very low levels of fluorescence. (C and D) Results of measurements of DCF fluorescence (C) and MitoSox Red fluorescence (D) intensities (arbitrary units; AU), expressed as a percentage of the values for Sirt3+/+ neurons. As a positive control for DCF measurement, Sirt3+/+ neurons were exposed to 100 μM H2O2. Values are the mean ± SEM (n = 5 mice). **p<0.01 (Student’s t-test). (E) ATP levels (normalized to cellular protein levels) in primary cultured Sirt3+/+ and Sirt3−/− cortical neurons (8 days in culture). Values are mean ± SEM (n = 4–5 mice). (F) ATP levels (normalized to cellular protein levels) in cerebral cortex and hippocampus tissues from 10 month old Sirt3+/+ and Sirt3−/− mice. Values are mean ± SEM (n = 9–12 mice). **p<0.01 (Student’s t-test). (G and H) Mitochondrial swelling assays. Mitochondria were isolated from the cerebral cortex of adult (12 month old) Sirt3+/+ and Sirt3−/− mice (G) or primary cultured Sirt3+/+ and Sirt3−/− neurons (H), and were then treated with vehicle or cyclosporin A (CsA; 2 μM) and then exposed to 800 μM CaCl2 and the optical density (OD 450 nm) of the mitochondria was monitored. Values are mean ± SEM (separate mitochondrial preparations from 4 or 5 mice). *p<0.05 and **p<0.01. (I and J) Cytosolic and mitochondrial Ca2+ concentrations were measured by imaging of the probes Fluo-8 and Rhod-2, respectively, prior to and during exposure of Sirt3+/+ and Sirt3−/− cortical neurons to 5 μM glutamate (C and D) (n = 15–30 neurons for each trace) without or with 20 min pretreatment with 1 μM CsA. Arrowheads mark the time of glutamate stimulation. Values are mean ± SEM. (K and L) Fluo-8 and Rhod-2 fluorescence (F/F0 value) at 300 s after exposure to glutamate. Values are mean ± SEM. *P<0.05 and **P<0.01.
Figure 5
Figure 5. Low levels of glutamate receptor stimulation, and voluntary wheel running, induce SIRT3 expression in brain cells.<
br>(A – C) Immunoblot analysis of SIRT3 protein levels in primary cortical neurons that had been exposed for 24 hours to vehicle (control) or the indicated concentrations of glutamate (Glut), kainate acid (KA) or NMDA. Each lane is a sample from an individual culture, and quantitative data include results of three separate experiments. Values were normalized to the actin level in the same sample, and values are expressed as percentage difference from the value for vehicle control cultures. *p<0.05 and **P<0.01 (ANOVA with Student Newman–Keuls post-hoc tests). (D – G) Immunoblot analysis of SIRT3 protein levels (D and F) and quantitative RT-PCR analysis of Sirt3 mRNA levels (E and G) in cerebral cortical (D, E) and hippocampal (F, G) tissues of wild type mice that were maintained for one month without (sedentary) or with running wheels in their cages. Values for SIRT3 protein and Sirt3 mRNA were normalized to actin protein or mRNA, respectively. Values are expressed as a percentage of the average value for sedentary mice and are mean ± SEM (n= 6–8 mice). *p < 0.05 and **p <0.01 (Student’s t-test). (H) Representative confocal images of double-label fluorescence staining of brain sections with a SIRT3 antibody (green) and NeuN (red) showing cerebral cortex of Sirt3−/− and Sirt3+/+ mice, and the hippocampal CA3 region in both sedentary and runner mice. Bar = 50 μm. The results of SIRT3 immunofluorescence intensity quantification are shown in the graph. The mean value in areal bins in the cortex (100 x 100 μm) and hippocampal CA3 region (50 x 100 μm) are expressed as a percentage of the mean value for sedentary mice (mean ± SEM; n= 4 mice). **p <0.01 (Student’s t-test). (I) Immunoblot analysis of SIRT3 in samples of hippocampal tissues of Sirt3+/+ and Sirt3−/− sedentary or running mice that received intraperitoneal injections of saline (control condition) or 0.5 mg/kg of the NMDA receptor antagonist MK80l once daily for 1 week. Sirt3 levels (densitometry analysis) (right panel) were normalized to actin protein levels and expressed as a percentage of the value for Sirt3+/+ sedentary mice. Values are mean ± SEM (n= 6 mice). **p <0.01.
Figure 6
Figure 6. Evidence that SIRT3 regulates neural cell mitochondrial protein acetylation homeostasis
(A) Immunoblot analysis of acetylated proteins, detected using an acetyl-lysine antibody, in samples of cortical tissue of adult (10 months old) Sirt3+/+ and Sirt3−/− mice. (B) Immunoblot analysis of protein acetylation in mitochondrial and cytosolic fractions of cerebral cortex tissue from 10 month-old Sirt3+/+ and Sirt3−/− mice. (C) Immunoblot analysis of acetylated proteins, detected using an acetyl-lysine antibody, in samples of hippocampal tissues of Sirt3+/+ and Sirt3−/− sedentary and runner mice. Actin was used as a loading control. The middle panel shows the densitometry curves for the 8 lanes of the blot in the left panel for the entire span of immunoreactive bands. Total protein acetylation levels (densitometry analysis) (right panel) were normalized to actin protein levels and expressed as a percentage of the value for Sirt3+/+ sedentary mice. Values are mean ± SEM (n= 6 mice). *p<0.05 and **p <0.01. (D and E) Proteins in lysates of hippocampal tissues from sedentary and runner Sirt3+/+ and Sirt3−/− mice were immunoprecipitated with SOD2 or cyclophilin D (CypD) antibodies or normal rabbit IgG (IgG) as negative control, respectively, and subjected to immunoblotting with antibodies to acetyl-lysine (Ac-SOD2 and Ac-CypD). The blots were reprobed with SOD2 and CypD antibodies to control for protein loading. Input means direct immunoblotting of tissue lysate using antibody against SOD2 (D) or CyPD (E) as positive controls. Arrows show the specific acetylated SOD2 (ac-SOD2) and CypD (ac-CypD) bands. Acetylated SOD2 (D) or CypD (E) levels (densitometry analysis) (right panel) are expressed as percentage of the value for sedentary Sirt3+/+ mice. Values are mean ± SEM (n = 6 mice). *p < 0.05, **p <0.01.
Figure 7
Figure 7. SIRT3 deficiency abolishes the excitoprotective effect of running, and neuronal vulnerability to excitotoxicity can be ameliorated by Sirt3 gene therapy, a mitochondria-targeted superoxide scavenger and a PTP inhibitor
(A) Representative confocal images showing NeuN immunostaining (green) and propidium iodide staining (PI; red) in the CA1 region of the hippocampus of Sirt3+/+ and Sirt3−/− mice that had been running for 30 days prior to, and for 7 days after, administration of KA. (B and C) Results of counts of undamaged neurons remaining in regions CA1 (B) and CA3 (C) of Sirt3+/+ and Sirt3−/− mice that had been maintained for 30 days without (sedentary) or with running wheels in their cages prior to intra-hippocampal infusion of KA, or sham surgery. Values are mean ± SEM (n= 5 mice per group). *p < 0.05, **p <0.01. (D) Immunoblot of SIRT3 and acetylysine in the hippocampal tissues from Sirt3+/+ mice after 24 h saline or KA stereotaxic injections. Actin was used as a loading control. (E) Immunoblot analysis of SIRT3 protein levels and protein acetylation levels in wild type cortical neurons 72 h after infection with AAV-GFP or AAV-Sirt3-IRES-GFP. The SIRT3 protein level and total acetylated protein levels (densitometric analysis) (graphs in panels D and E) are normalized to actin protein levels and expressed as percentage of the value for Sirt3+/+ mice. Values are mean ± SEM (n = 4 mice). *p < 0.05, **p <0.01. (F) Results of quantitative analysis of cell death in cultures of Sirt3+/+ and Sirt3−/− cortical neurons that had been infected with AAV-GFP or AAV-Sirt3-IRES-GFP) for 3 days and then exposed for 24 hours to glutamate, KA or NMDA (200 μM each). Cell death was quantified as described in the Figure 1 legend. (G – I) Sirt3+/+ and Sirt3−/− cortical neurons were pretreated with the indicated agents and then exposed to 200 μM glutamate (G), KA (H) or NMDA (I) for 24 hours. Cell death was quantified as described in the Figure 1 legend. NAC, N-acetyl-L-cysteine (1 mM); mitoTEMPO, a mitochondrial superoxide scavenger (1 μM); CsA, the mitochondrial PTP inhibitor cyclosporin A (1 μM). Values are mean ± SEM (separate cultures from 4 or 5 mice; 6 images per culture were analyzed). *p<0.05 and **P<0.01.

References

    1. Ahn BH, Kim HS, Song S, Lee IH, Liu J, Vassilopoulos A, Deng CX, Finkel T. A role for the mitochondrial deacetylase Sirt3 in regulating energy homeostasis. Proc Natl Acad Sci U S A. 2008;105:14447–14452. - PMC - PubMed
    1. Andreassen OA, Ferrante RJ, Dedeoglu A, Albers DW, Klivenyi P, Carlson EJ, Epstein CJ, Beal MF. Mice with a partial deficiency of manganese superoxide dismutase show increased vulnerability to the mitochondrial toxins malonate, 3-nitropropionic acid, and MPTP. Exp Neurol. 2001;167:189–195. - PubMed
    1. Bruce-Keller AJ, Umberger G, McFall R, Mattson MP. Food restriction reduces brain damage and improves behavioral outcome following excitotoxic and metabolic insults. Ann Neurol. 1999;45:8–15. - PubMed
    1. Chalkiadaki A, Guarente L. Sirtuins mediate mammalian metabolic responses to nutrient availability. Nat Rev Endocrinol. 2012;8:287–296. - PubMed
    1. Cheng A, Wan R, Yang JL, Kamimura N, Son TG, Ouyang X, Luo Y, Okun E, Mattson MP. Involvement of PGC-1α in the formation and maintenance of neuronal dendritic spines. Nat Commun. 2012;3:1250. - PMC - PubMed

Publication types

MeSH terms

LinkOut - more resources